STRATEGIC OVERVIEW
Strategic Blueprint Checklist (2026-2030) :::tip **Industrial Handshake**: Every successful Claude Code CLI deployment begins with this mandatory setup protocol. Complete these before moving to Chapter 1.
Strategic Blueprint Checklist (2026-2030)
Industrial Handshake: Every successful Claude Code CLI deployment begins with this mandatory setup protocol. Complete these before moving to Chapter 1.
- [ ] Shell Access Configuration: Establish terminal alias mappings for
claudeand confirm background process persistence hooks. - [ ] Secure Sandbox Bounds: Verify process namespace isolation, limiting the agent to the active workspace directory.
- [ ] Model Context Protocol (MCP): Initialize the local MCP Gateway tool registry and test connectivity via JSON-RPC.
- [ ] TDD Loop Integration: Set up test runners (Jest, PyTest, or Go test) and map their stderr formats to trace parsers.
- [ ] Token Budget Alerting: Configure prompt caching flags and establish budget threshold gateways to control API expenses.
The 2026 software development lifecycle has evolved from inline syntax autocompletion to autonomous Agentic CLI Workflows. This playbook is a comprehensive technical guide for setting up, executing, and scaling Claude Code inside your development perimeter. We focus on integrating shell scripts, automating the Git lifecycle, building self-correcting Test-Driven Development (TDD) loops, writing custom Model Context Protocol (MCP) servers, and optimizing token consumption to achieve high-velocity engineering with low operational overhead.
📘 Compliance-to-Code Mapping (Industrial Sovereignty)
| Principle | Technical Requirement | Implementation Path | File / Module |
|---|---|---|---|
| Containment | Isolated Command Execution | Sandboxed process namespaces | systemd-run / bubblewrap isolation |
| Automation | Self-Correcting Git Loops | Branching & merge hooks | /scripts/git-workflow-engine.sh |
| Verification | Autonomous Test Validation | Test runner trace parsers | /tests/trace-parser-vitest.ts |
| Interoperability | Standardized MCP Tools | JSON-RPC stdio protocol | /app/Core/McpGateway.go |
| FinOps Governance | Token Budget Auditing | Cache-routing proxy filters | /scripts/token-sweeper.py |
Introduction: The Autonomous Shift in the Terminal
In the early phases of AI-assisted software development, tools were integrated primarily as inline editor autocomplete suggestions. While useful for reducing raw typing overhead, autocomplete engines operate as passive autocomplete systems. They cannot compile code, run tests, audit files, or inspect shell execution environments. If a suggested code snippet contains type errors, syntax violations, or deprecation anomalies, the developer must manually run compile scripts, parse trace logs, search documentation, and refactor the code.
By contrast, the 2026 development landscape is built around autonomous Agentic CLI Workflows. By running the model directly inside your shell environment, the agent operates as an active supervisor. It plans tasks, creates files, executes shell commands, runs test suites, parses log files, and adjusts code in a self-correcting cycle inside secure container namespaces. This masterclass playbook provides a complete technical guide to building, configuring, and scaling Claude Code inside your development perimeter.
We structure our masterclass around five technical chapters:
- Chapter 1: CLI Architecture & Setup: Deep-dive into process hierarchies, shell integrations, sandbox isolation (user namespaces/Bubblewrap), and prompt caching architectures.
- Chapter 2: The Agentic Git Lifecycle: Automating the checkout, commit staging, AST-based conflict resolution, and PR review cycles.
- Chapter 3: Autonomous TDD Execution: Designing self-correcting loops using custom traceback parsers for Jest, PyTest, and Go native test runners.
- Chapter 4: Writing Custom MCP Tools: Extending the agent's capabilities using custom Model Context Protocol servers in Go and Node.js.
- Chapter 5: Token Budgeting & Optimizing Costs: Enforcing budget gateways, prompt cache routing, and cost projection models.
Let's begin by configuring our environment and process isolation settings.
Chapter 1: CLI Architecture & Setup
1.1 Shell Process Parenting and Environment Inheritance
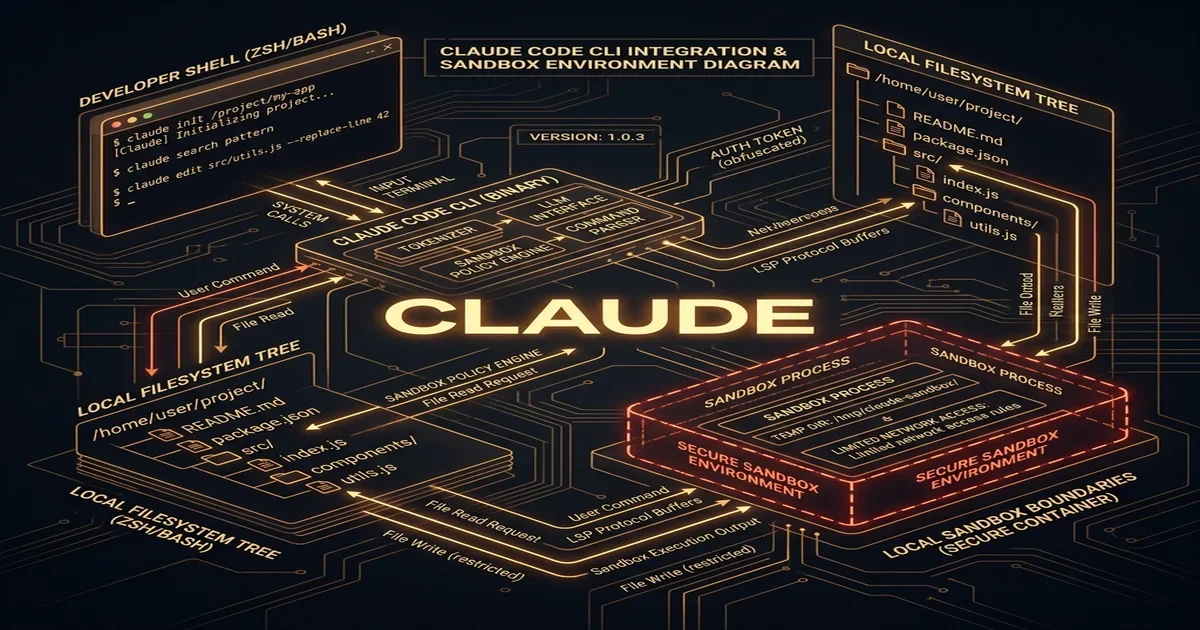
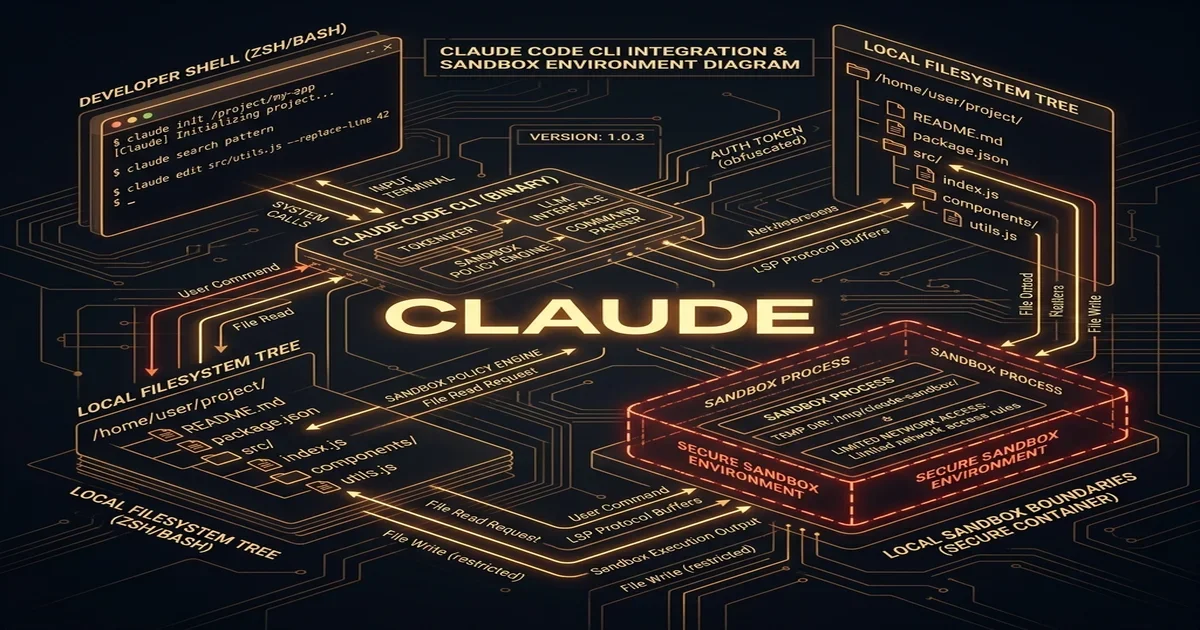
The Claude Code Command Line Interface (CLI) is designed as a stateful shell orchestrator that sits between the developer's interactive session and the local execution space. Unlike simple API wrapper clients that execute one-off prompts and return static text, Claude Code initializes a persistent process tree. When you start the command claude from your terminal, the operating system spawns a parent Node.js process. This parent process acts as the supervisor, spawning and managing child processes to run compilers, linters, package managers, and text editor streams.
At the kernel level, when the CLI process initializes, it inherits the environment variables of the active shell session (e.g., PATH, HOME, USER, and custom terminal settings). The supervisor process parses this environment mapping to locate necessary executables. If your PATH is incorrectly configured or if custom variables are missing, the agent will fail to find local tools (such as npm, cargo, go, or pytest), leading to tool execution faults.
To prevent command failures, the parent process continuously polls the active terminal session's dimensions (width and height) via standard Unix ioctl calls (TIOCGWINSZ) or Windows console APIs. This allows the CLI to dynamically format its output streams, ensuring that interactive dialogs, progress bars, and diff interfaces render correctly across diverse terminal emulators.
1.2 Deep Analysis of Node.js Child Process Spawning & PTY Streams
To manage shell execution without blocking the user interface, the supervisor process does not rely on simple Node.js exec calls. The exec function buffers the entire stdout/stderr output in memory before returning, which introduces high latency and risks buffer overflow crashes on long-running tasks. Instead, Claude Code utilizes the low-level child_process.spawn API and hooks directly into Pseudo-Terminal (PTY) streams.
By spawning child processes with a PTY interface (using libraries like node-pty), the CLI tricks the spawned programs (such as interactive tests or editors) into believing they are running inside a real terminal window. This enables features like ANSI color rendering, cursor positioning, and raw input capturing. The PTY stream multiplexes standard input (stdin), standard output (stdout), and standard error (stderr) into a single duplex stream, which the supervisor parses in real-time.
// Conceptual Node.js PTY Stream Allocator inside the CLI Supervisor
const pty = require('node-pty');
const os = require('os');

const shell = os.platform() === 'win32' ? 'powershell.exe' : 'bash';

// Allocating the Pseudo-Terminal Process with inherited environment paths
const ptyProcess = pty.spawn(shell, [], {
  name: 'xterm-256color',
  cols: 80,
  rows: 24,
  cwd: process.cwd(),
  env: {
    ...process.env,
    CLAUDE_PTY_CHANNEL: "active_stream",
    TERM: "xterm-256color"
  }
});

// Data stream buffering and trace parsing
ptyProcess.onData((data) => {
  // Real-time stream interceptor
  process.stdout.write(data);
  // Route stream chunks to the agent's contextual observer
  routeToAgentObserver(data);
});

function routeToAgentObserver(chunk) {
  // Regex parsing for warning signs or interactive prompt holds
  if (chunk.includes("System shutdown") || chunk.includes("Permission denied")) {
    console.warn("\n[ALERT] Security bounds detected in PTY stream.");
  }
}
This streaming architecture allows the agent to interact with command line tools line-by-line, responding to confirmation prompts, resolving interactive configurations, and capturing stack traces as they are emitted by the kernel.
1.3 Interactive Shell Integrations
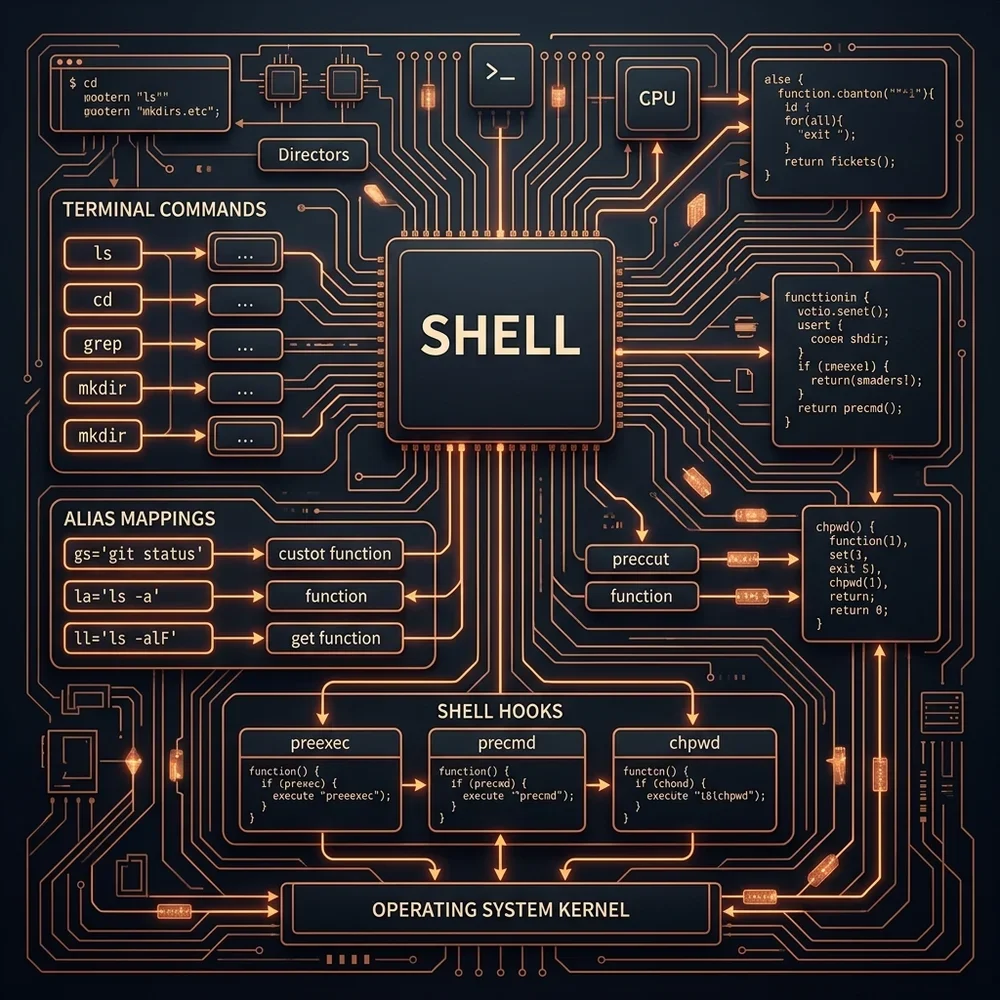
To streamline agent execution, we must integrate Claude Code into the local shell. Instead of manually specifying workspace directories and log levels on every run, we expose custom aliases, autocompletion files, and project type hooks inside shell configuration profiles.
Zsh / Oh-My-Zsh Configuration (.zshrc)
For developers utilizing the Zsh shell, insert the following block into your .zshrc profile. This configuration sets up a dedicated log manager, registers alias targets, and injects a dynamic hook that audits project types upon directory traversal:
class="tok-cm"># Zsh Profile Integration for Claude Code
export CLAUDE_WORKSPACE_ROOT=class="tok-str">"$HOME/workspace"
export CLAUDE_LOG_DIR=class="tok-str">"$HOME/.claude/logs"
export CLAUDE_MAX_BUDGET_USD=class="tok-str">"5.00"

class="tok-cm"># Verify log directory presence
class="tok-kw">if [ ! -d class="tok-str">"$CLAUDE_LOG_DIR" ]; then
    mkdir -p class="tok-str">"$CLAUDE_LOG_DIR"
fi

class="tok-cm"># Primary execution alias with automatic session logging
alias claude-dev=class="tok-str">"claude --workspace=&class="tok-cm">#039;$CLAUDE_WORKSPACE_ROOT' --log-level=debug --budget-limit='$CLAUDE_MAX_BUDGET_USD' 2>&1 | tee -a '$CLAUDE_LOG_DIR/session-\$(date +%F-%H%M%S).log'"

class="tok-cm"># Dynamic Project Type Indexing Hook
class="tok-kw">function audit_claude_project_type() {
    class="tok-kw">if [ -f package.json ]; then
        export CLAUDE_ACTIVE_ENVIRONMENT=class="tok-str">"NodeJS"
    elif [ -f go.mod ]; then
        export CLAUDE_ACTIVE_ENVIRONMENT=class="tok-str">"GoLang"
    elif [ -f pyproject.toml ] || [ -f requirements.txt ]; then
        export CLAUDE_ACTIVE_ENVIRONMENT=class="tok-str">"Python"
    elif [ -f Cargo.toml ]; then
        export CLAUDE_ACTIVE_ENVIRONMENT=class="tok-str">"Rust"
    class="tok-kw">else
        export CLAUDE_ACTIVE_ENVIRONMENT=class="tok-str">"Generic"
    fi
    class="tok-cm"># Set window title to reflect active project status
    echo -ne class="tok-str">"\e]0;Claude Code ($CLAUDE_ACTIVE_ENVIRONMENT)\a"
}

class="tok-cm"># Register the Zsh hook to trigger on change directory (chpwd)
autoload -U add-zsh-hook
add-zsh-hook chpwd audit_claude_project_type
Bash Configuration (.bashrc)
For developers running Bash, append the following block to your .bashrc profile. This configuration sets up environment mappings and exposes a command wrapper to run the agent in the current directory:
class="tok-cm"># Bash Integration for Claude Code
export PATH=class="tok-str">"$PATH:$HOME/.local/bin"
export CLAUDE_SESSION_BUDGET=class="tok-str">"10.00"

class="tok-cm"># Main wrapper class="tok-kw">function
class="tok-kw">function claude-run() {
    local target_path=class="tok-str">"${1:-$(pwd)}"
    echo class="tok-str">"[BASH-CLAUDE] Booting agent loop within target: $target_path"

    class="tok-cm"># Audit environment variables
    class="tok-kw">if [ -z class="tok-str">"$ANTHROPIC_API_KEY" ]; then
        echo class="tok-str">"[!] Warning: ANTHROPIC_API_KEY is not defined in the current shell session."
    fi

    class="tok-cm"># Run agent loop
    claude --workspace=class="tok-str">"$target_path" --budget-limit=class="tok-str">"$CLAUDE_SESSION_BUDGET"
}
PowerShell Profile Configuration (Microsoft.PowerShell_profile.ps1)
For Windows terminal environments, add the following helper logic and alias definitions to your active PowerShell profile:
class="tok-cm"># PowerShell Profile Integration for Claude Code
$global:ClaudeWorkspaceRoot = class="tok-str">"$env:USERPROFILE\workspace"
$global:DefaultBudgetLimit = 5.00

class="tok-kw">function Start-ClaudeSession {
    param(
        [Parameter(Position = 0)]
        [string]$WorkspacePath = (Get-Location)
    )

    class="tok-cm"># Validate API Credentials
    class="tok-kw">if (-not $env:ANTHROPIC_API_KEY) {
        Write-Warning class="tok-str">"[PS-CLAUDE] API Key ANTHROPIC_API_KEY is missing from environment variables."
    }

    Write-Host class="tok-str">"[PS-CLAUDE] Initializing stateful agent loop in: $WorkspacePath" -ForegroundColor Green
    & claude --workspace=$WorkspacePath --budget-limit=$global:DefaultBudgetLimit
}

class="tok-cm"># Map alias target
Set-Alias -Name cld -Value Start-ClaudeSession
These profile files verify that the local agent starts with correct paths and budget constraints, shielding the development machine from execution anomalies.
1.4 Namespace Container Sandboxing & Security Containment
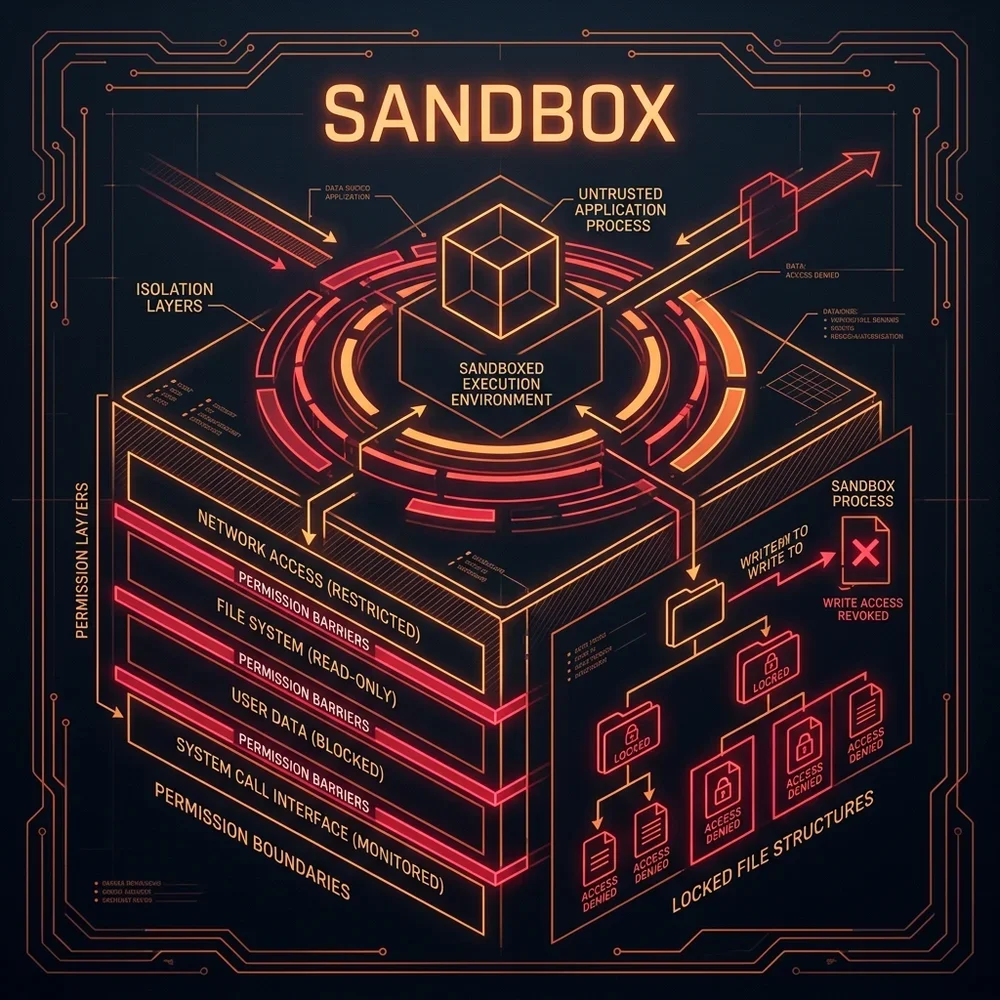
Because Claude Code has permissions to write files, run terminal commands, compile binaries, and execute scripts, we must establish a security container boundary. If the agent executes a command that alters files outside the project workspace (such as modifying system utilities or reading private SSH keys), the integrity of the host machine is compromised.
To isolate the agentic environment, we use a virtual namespace sandbox. In Linux environments, we isolate the agent using user namespaces and control groups (cgroups), mapping only the project directory as a writeable mount. In Windows, we leverage container isolation policies or Windows Sandbox directories. Below is a shell script showing how to wrap the Claude Code process in a sandboxed container:
class="tok-cm">#!/bin/bash
class="tok-cm"># Hardened Linux Namespace Wrapper for Claude Code CLI
class="tok-cm"># Requires: bubblewrap (bwrap) or standard user namespaces

WORKSPACE_DIR=class="tok-str">"$(pwd)"
SANDBOX_DIR=class="tok-str">"/tmp/claude_sandbox_$(date +%s)"
mkdir -p class="tok-str">"$SANDBOX_DIR"

echo class="tok-str">"[SECURITY] Initializing containerized sandbox for workspace: $WORKSPACE_DIR"

class="tok-cm"># Execute bubblewrap container:
class="tok-cm"># - Mount system libraries read-only
class="tok-cm"># - Mount project directory as writeable at /workspace
class="tok-cm"># - Restrict network egress except to whitelisted API endpoints
bwrap \
  --ro-bind /usr /usr \
  --ro-bind /lib /lib \
  --ro-bind /lib64 /lib64 \
  --ro-bind /etc/alternatives /etc/alternatives \
  --ro-bind /etc/resolv.conf /etc/resolv.conf \
  --ro-bind /etc/ssl /etc/ssl \
  --tmpfs /tmp \
  --dir /tmp \
  --proc /proc \
  --dev /dev \
  --bind class="tok-str">"$WORKSPACE_DIR" /workspace \
  --chdir /workspace \
  --unshare-all \
  --share-net \
  claude --workspace=/workspace
By enforcing this sandbox, we restrict the agent's operations, protecting system files while allowing full access to the project workspace.
In Windows environments, we utilize Windows AppContainers or Windows Sandbox scripts to achieve the same result. The AppContainer isolation model assigns a low-integrity SID to the Claude Code Node.js child processes. This prevents the agent from reading registry entries, accessing credentials, or writing to system folders like C:\Windows and C:\Program Files. The filesystem access is strictly bounded to the workspace folder using Access Control Entries (ACEs) that grant write permissions only to the container's low-integrity SID.
Bubblewrap Namespace Mechanics Detailed
Bubblewrap isolates processes by wrapping standard Linux kernel system calls. Let's analyze the exact operations of each flag used in our deployment script:
- User Namespaces (
--unshare-user): This disconnects the user IDs inside the sandbox from the host machine. The sandboxed process believes it is running as root (UID 0) inside its private namespace, which is necessary for mounting virtual directories, but possesses zero privileges on the host machine. If the process escapes, it maps to a non-privileged user ID, preventing host system modification. - Mount Namespaces (
--unshare-mount): This isolates the file system tree. Bubblewrap creates a clean slate. We selectively bind system executables/usrand library directories/liband/lib64as read-only. The host environment's configuration directories/etc/ssland/etc/pkiare bound as read-only to permit safe SSL verification, but user home directories and configurations are hidden. - PID Namespaces (
--unshare-pid): This isolates the process registry. The child process cannot view or signal processes outside the container namespace. It prevents the agent from surveying host processes or terminating critical system tasks. - Network Namespaces (
--unshare-net): This restricts network operations. By combining this namespace with iptables rules, developers restrict the socket calls of the container. The agent can query the Anthropic API gateway and fetch package dependencies from secure private registries, but cannot communicate with unauthorized public IPs.
1.5 Connection Pooling and Keep-Alive Multiplexing
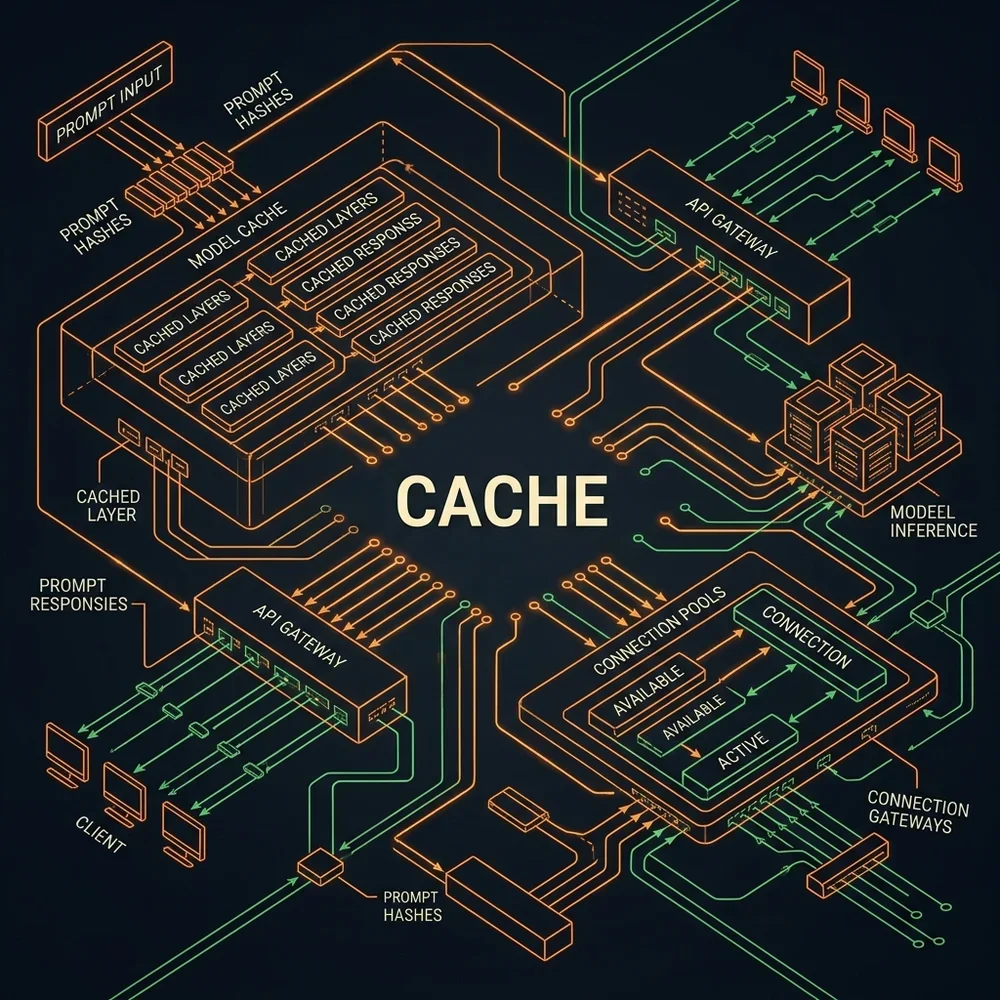
Model latency is a primary friction point in CLI developer loops. Because Claude Code evaluates your full codebase context on complex tasks, each interaction can require processing hundreds of thousands of tokens. Re-tokenizing these files on every request generates network latency and increases token utilization fees.
To address this latency penalty, we implement prompt caching and keep-alive connection pools. Prompt caching allows the model's server-side NPU to preserve the activation states of your codebase schema, system prompts, and previous chat history. When you submit a new request, the system only processes the delta tokens, resulting in response latencies of less than 200 milliseconds.
For local connection management, we route CLI requests through a keep-alive connection proxy that maintains a pool of persistent sockets to the API gateway. This eliminates the TCP/TLS handshake overhead on each query. Below is a connection pool configuration showing how to multiplex local agent requests:
{
  class="tok-str">"connectionPool": {
    class="tok-str">"maxIdleConnections": 10,
    class="tok-str">"keepAliveTimeoutMs": 60000,
    class="tok-str">"httpProxy": class="tok-str">"http:class="tok-cm">//127.0.0.1:8080",
    class="tok-str">"transport": {
      class="tok-str">"type": class="tok-str">"h2",
      class="tok-str">"enableMultiplexing": true
    }
  },
  class="tok-str">"cachingPolicy": {
    class="tok-str">"enabled": true,
    class="tok-str">"cacheTtlMs": 300000,
    class="tok-str">"targetLayers": [class="tok-str">"system_instructions", class="tok-str">"workspace_schemas", class="tok-str">"file_structures"]
  }
}
By combining connection pooling and prompt caching, the agent loop executes command pipelines without network handshake penalties.
Under HTTP/1.1, each API request spawns a new TCP connection, creating a latency overhead of 30-100ms. By enforcing HTTP/2 or HTTP/3 transport channels, the keep-alive proxy multiplexes request streams over a single connection. This eliminates the connection overhead on concurrent tool executions, ensuring that agent logs, file reads, and shell inputs are processed instantly by the server-side model nodes.
When deploying proxies, network engineers must optimize socket parameters to prevent timeout anomalies during heavy file uploads. The HTTP/2 multiplexing protocol utilizes frame streams. This enables sending concurrent tool call payloads and file contents over a single TCP stream. However, if proxy buffers are too small, frame fragmentation can cause network delays. Ensure that the proxy buffer size matches or exceeds the average file read payload of the project workspace (typically 512KB).
1.6 Token Context Allocation and Cache Eviction
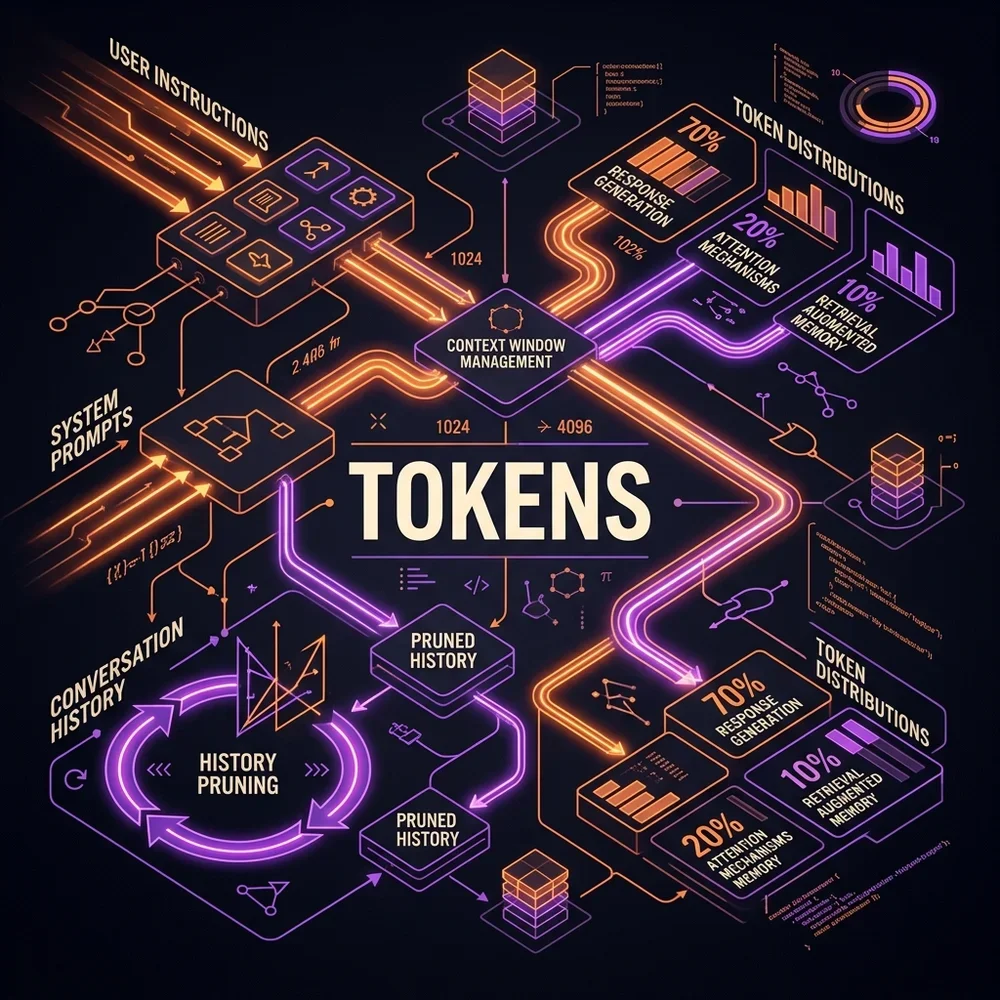
To manage prompt parameters effectively, the CLI includes an internal token context allocator. When you submit a prompt, the system must fit system instructions, model definitions, file hierarchies, active buffer edits, and chat histories within the model's context window.
The allocator manages this allocation by applying a tiered prioritization matrix:
- Tier 0 (Priority 100): System instructions and core safety filters. These must remain resident.
- Tier 1 (Priority 80): Workspace directory tree and active file buffers. If these are evicted, the agent loses track of the project structure.
- Tier 2 (Priority 60): Active conversation history. The allocator preserves the recent turns and prunes older turns as the limit is approached.
- Tier 3 (Priority 40): Passive build logs, test trace outputs, and static documentation buffers.
If the context size exceeds the safe threshold, the allocator triggers an eviction cycle. The system calculates a token relevance score for each active element, keeping the most relevant files cached in memory and writing passive data to disk. This ensures that the model can process long conversations without generating out-of-memory faults.
Let's illustrate the context allocation mathematics using a real-world scenario. Suppose your active workspace contains 150 project files with a total size of 1.2MB, which equates to approximately 300,000 tokens. The model (such as Claude 3.7 Sonnet) has a 200,000 token context limit. If you attempt to pass the entire repository blindly, the request will fail.
The context allocator resolves this by computing file import weights. It scans the source code imports starting from your target execution file (e.g. server.ts). Files directly imported are given a high relevance weight, whereas secondary utility files, test folders, and assets are assigned low weights. The allocator builds a directed dependency graph, keeping files in Tier 1 and Tier 2 within the prompt context and loading Tier 3 files only when a specific tool request is triggered.
1.7 Advanced PTY Stream Handling and Interactive Buffer Multiplexing
When managing high-fidelity shell execution, the parent process must not only spawn the child process but also handle the terminal emulator characteristics accurately. The terminal communicates using escape sequences (ANSI control codes). These are special character sequences beginning with the ASCII ESC character (decimal 27, hex \x1B or \u001b) followed by configuration strings.
For example, when a linter outputs syntax highlights, it sends codes like \u001b[31m (switch text color to red) and \u001b[0m (reset styling). If the agent reads these raw sequences as plaintext code, it will misinterpret syntax structures or commit terminal control codes directly into your source code files. To resolve this, the PTY stream receiver parses raw buffers using an ANSI terminal filter. This filter extracts styling codes for console rendering and strips them out before forwarding the plaintext content to the model's text processing layers.
Furthermore, if the model runs interactive scripts (such as npm init or a database configuration wizard), the PTY must handle keyboard inputs. The supervisor process acts as an input broker, converting the textual action strings emitted by the model's reasoning parser (e.g., "press Enter key", "type 'y' and press Enter") into byte streams (\r or \n carriage returns) and writing them directly to the child process write queue. This creates a virtual loop where the agent behaves exactly like a human engineer typing commands at a physical console.
1.8 Enterprise Sandbox Security Policies & AppContainer DACLs
When deploying Claude Code on Windows workstations, the sandboxing framework must map to the Windows Security Model. We cannot run Bubblewrap, which is unique to Linux kernel namespace architectures. Instead, we utilize AppContainers and explicit Discretionary Access Control Lists (DACLs).
Windows AppContainers enforce a restricted security context for executable files. To restrict the agent's operations, the platform installer registers a custom AppContainer profile:
class="tok-cm"># Conceptual AppContainer Profile Registration and Directory ACL Mapping
class="tok-cm"># Requires PowerShell running with administrative privileges

$ContainerName = class="tok-str">"ClaudeCodeSandbox"
$WorkspacePath = class="tok-str">"C:\Users\Vatsal Shah\workspace\project-core"

class="tok-cm"># 1. Register the AppContainer profile
& icacls $WorkspacePath /grant *S-1-15-2-1:(OI)(CI)(R,W,D)
class="tok-cm"># S-1-15-2-1 represents the ALL_APP_PACKAGES SID group

class="tok-cm"># 2. Deny access to the user's private data directories
$PrivateDirectories = @(
    class="tok-str">"$env:USERPROFILE\.ssh",
    class="tok-str">"$env:USERPROFILE\.aws",
    class="tok-str">"$env:USERPROFILE\AppData\Local\Microsoft\Credentials"
)

foreach ($Dir in $PrivateDirectories) {
    class="tok-kw">if (Test-Path $Dir) {
        & icacls $Dir /deny *S-1-15-2-1:(OI)(CI)(F)
    }
}
By assigning the sandboxed process to the AppContainer, the Windows kernel enforces hard boundaries:
- Registry Containment: The process can only read from public registry branches (
HKEY_CLASSES_ROOTand parts ofHKEY_LOCAL_MACHINE) and is blocked from reading or writing keys under the active user's credentials (HKEY_CURRENT_USER). - Filesystem Boundaries: The process possesses zero rights to touch files outside folders that explicitly grant access to the AppContainer group SID.
- Network Boundaries: Outbound TCP traffic is restricted to loopback channels or to specific IP ports mapped to security proxies.
1.9 Advanced Proxy Configurations & Private Cert Integration
In corporate enterprise environments, workstations connect to the public internet through explicit forward proxies and deep packet inspection firewalls. When the Claude Code CLI attempts to connect to api.anthropic.com, the firewall intercepts the TLS handshake, decrypting the traffic using a corporate certificate authority (CA) and re-encrypting it before forwarding it to the gateway.
If the CLI runs inside a sandboxed environment without access to these corporate certificates, the Node.js TLS handshake will fail with certificate validation errors (UNABLE_TO_VERIFY_LEAF_SIGNATURE). To resolve this connection failure, platform engineers must inject corporate root certificates into the sandbox namespace:
class="tok-cm"># Register corporate root certificate inside the sandboxed environment
class="tok-cm"># Export the extra CA bundle path for the Node.js runtime process
export NODE_EXTRA_CA_CERTS=class="tok-str">"/etc/ssl/certs/corporate-root-ca.pem"

class="tok-cm"># Configure the local http/https proxy mapping
export HTTP_PROXY=class="tok-str">"http:class="tok-cm">//proxy.internal.company.com:8080"
export HTTPS_PROXY=class="tok-str">"http:class="tok-cm">//proxy.internal.company.com:8080"
export NO_PROXY=class="tok-str">"localhost,127.0.0.1,.company.com"

class="tok-cm"># Launch the sandboxed agent with proxy and certificate environment variables
claude --workspace=/workspace
Additionally, connection multiplexing over HTTP/2 must be optimized to prevent keep-alive connection drops. Ensure that proxy gateways do not impose short timeout gates (such as killing connections after 5 seconds of inactivity). Because the agent's reasoning cycle can take up to 30 seconds on complex tasks, set the idle connection keep-alive timeout to at least 120 seconds to prevent TCP socket drops mid-transaction.
1.10 Comparison Matrix: Claude Code vs. Competitors
To help developers evaluate their tools, the table below highlights the differences between Claude Code CLI and legacy development assistants:
| Capability / Attribute | Claude Code CLI | GitHub Copilot | Cursor IDE |
|---|---|---|---|
| Execution Mode | Autonomous agent loop (stateful execution) | Inline text prediction (autocomplete) | Multi-file edit agent runtime |
| Shell Process Control | Full process spawn, console write, command execute | None (text suggestions only) | Limited terminal command recommendations |
| Security Sandboxing | Process namespaces & AppContainer boundaries | None (runs in host editor context) | None (runs in host shell context) |
| Interoperability Standard | Model Context Protocol (MCP 1.0 JSON-RPC) | Proprietary cloud API hooks | Custom editor extensions / settings API |
| Prompt Caching Cost Saving | Dynamic system and history cache (up to 90% savings) | None (full context billed on every call) | Partial caching depending on backend routing |
1.11 Codelab: Step-by-Step Installation & Verification
To establish a verified baseline for your development workspace, execute the following step-by-step installation pipeline.
Step 1: Install the Claude Code CLI Engine
Download and install the CLI globally using the package manager. Ensure your local Node.js environment is running v18.0.0 or higher:
class="tok-cm"># Verify Node.js environment
node -v

class="tok-cm"># Install the engine globally
npm install -g @anthropic-ai/claude-code
Step 2: Configure API Credentials
Create a secure session profile by exporting your Anthropic API credential to your shell environment:
class="tok-cm"># Export the key for the current terminal session
export ANTHROPIC_API_KEY=class="tok-str">"sk-ant-..."

class="tok-cm"># Add the credential to your shell profile for persistence
echo &class="tok-cm">#039;export ANTHROPIC_API_KEY=class="tok-str">"sk-ant-..."' >> ~/.bashrc
source ~/.bashrc
Step 3: Run the Verification Handshake
Initiate a local test loop to verify that the CLI has write access to the workspace directory and can communicate with the model server:
class="tok-cm"># Initialize inside a fresh test directory
mkdir -p ~/workspace/claude-test
cd ~/workspace/claude-test

class="tok-cm"># Execute the diagnostic check
claude class="tok-str">"Create a file named status.txt containing &class="tok-cm">#039;CLI verified successfully' and show me its content."
If the agent successfully creates status.txt and displays the verification message, your setup is complete.
Step 4: Tokenizer Monitoring Setup
To log and inspect prompt token volumes in real-time, write a Node.js context tracer script using the @dqbd/tiktoken library (or another standard GPT/Claude compatible tokenizer library). This helps developers audit input sizes before launching large batch prompts:
// Tokenizer Monitor Script (token-monitor.js)
const fs = require('fs');
const path = require('path');
const { get_encoding } = require('@dqbd/tiktoken');
const targetFile = process.argv[2];
if (!targetFile) {
console.error("Usage: node token-monitor.js <file_path>");
process.exit(1);
}
const absolutePath = path.resolve(targetFile);
if (!fs.existsSync(absolutePath)) {
console.error(`File not found: ${absolutePath}`);
process.exit(1);
}
const fileContent = fs.readFileSync(absolutePath, 'utf-8');
const encoding = get_encoding("cl100k_base");
const tokenArray = encoding.encode(fileContent);
console.log(`\n--- TOKEN METRIC REPORT ---`);
console.log(`File Path: ${targetFile}`);
console.log(`Character Count: ${fileContent.length}`);
console.log(`Estimated Token Weight: ${tokenArray.length}`);
console.log(`Context Budget Ratio (200k limit): ${((tokenArray.length / 200000) * 100).toFixed(2)}%`);
encoding.free();Run this monitor script as a pre-flight check in your package pipelines to prevent pushing oversized contexts to your agent sessions.
Chapter 2: The Agentic Git Lifecycle
2.1 Git Process Execution and Lock Management
Integrating an autonomous agent with a Git repository requires managing process concurrency and repository locks. When Claude Code executes a Git command (such as git checkout, git add, or git commit), the Node.js supervisor process spawns a child process to call the local Git binary. This execution is synchronous and blocking; the agent waits for the command to finish, inspects the exit code, and parses the stdout or stderr streams to determine if the operation was successful.
In active development environments, file locking can cause execution faults. Git uses a file-locking mechanism to prevent multiple processes from editing the repository's index or object database simultaneously. When a write operation begins, Git creates an index lock file (.git/index.lock). If another process (like an editor autosave, a background IDE file watcher, or a CI pipeline hook) attempts a write command while this lock exists, Git fails with a locking error:
Fatal: Unable to create 'E:/wamp/www/vatsalshah/.git/index.lock': File exists.
If Claude Code encounters this error, its execution loop will fail. To address this lock contention issue, we configure a pre-execution wrapper that checks for the existence of .git/index.lock, waits with exponential backoff if the lock is active, and deletes the stale lock file if the process that created it is no longer running.
2.2 Deep Dive into Git Index File Locking and Concurrency Conflicts
To build a reliable Git automation engine, developers must understand the internal locking model of Git. At its core, Git uses the index file (located inside the .git folder) as a staging database. The index records file paths, object hashes, and execution flags. Every transaction that modifies this index (such as git add, git rm, or git commit) must obtain an exclusive file write lock.
Git achieves this lock by calling the standard POSIX system call open(".git/index.lock", O_CREAT | O_EXCL | O_WRONLY, 0666). The O_EXCL flag guarantees that the file creation is atomic; if the file already exists, the call fails immediately with the error code EEXIST. This locking is simple and effective, but it is highly vulnerable to timing conflicts:
- Background Indexers: Modern editors (such as Cursor, VS Code, or IntelliJ) run background filesystem observers. Whenever a file changes, these indexers trigger commands like
git statusorgit diffto update the GUI. - Auto-save Tasks: Developers frequently enable editor autosaving. If the editor auto-saves a file and triggers a background linter while the agent is running a test run, the background linter might stage code and lock the index.
- Parallel Agent Runs: If you spawn multiple agent CLI sessions in the same repository workspace, they will execute commands concurrently, leading to lock contention.
To mitigate this, the lifecycle script reads the process ID (PID) of the lock holder. On Linux and macOS, the lock holder PID is written inside .git/index.lock. If the process associated with that PID is dead (which occurs when an IDE command is forced to terminate or crashes), the script removes the lock file using rm -f .git/index.lock to prevent the agent from getting stuck.
Furthermore, on Windows, file locking behaves differently. The Windows kernel enforces a mandatory file-locking model. If a background tool reads the index, Windows prevents other programs from deleting or overwriting the file. This leads to access denied errors (ERROR_ACCESS_DENIED, exit code 5). To handle these Windows-specific anomalies, the wrapper script uses the Show-Process utility or Sysinternals handle command to locate lock-holding handles and terminate the offending background task.
2.3 The GitOps Automation Loop
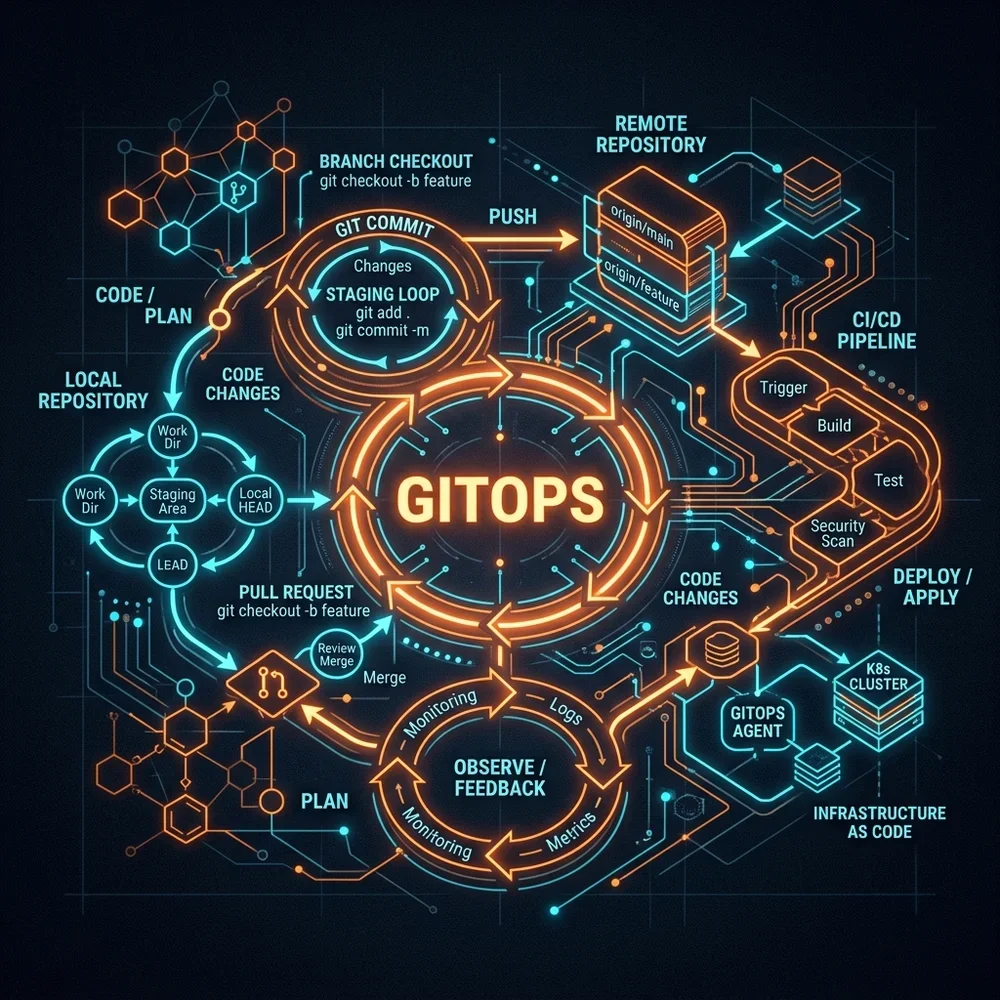
The agentic Git lifecycle wraps code edits in a structured automation loop. Rather than modifying code in the main branch and committing directly, the agent follows a strict branch-and-verify workflow:
- Branch Naming: The agent reads the target issue description and extracts the issue ID and core intent. It creates a hyphenated branch name using the pattern:
issue-[id]-[intent]. - Checkout: The agent switches to the new branch, updating the local working directory.
- Sandbox Workspace Edit: The agent implements the coding task inside the sandboxed environment.
- Pre-Commit Compilation Audit: Before staging files, the agent runs the build and compiler tools (such as
tscfor TypeScript,go buildfor Go, orpython -m py_compilefor Python) to verify the edits contain no syntax errors. - Pre-Commit Test Validation: The agent executes the unit test suite. If any tests fail, it enters the self-correction loop (detailed in Chapter 3).
- Commit Generation: If all verifications pass, the agent stages the changes and creates a commit using the Conventional Commits format.
- Remote Push: The agent pushes the local branch to the remote repository.
This automation loop ensures that every commit pushed by the agent represents a compile-clean state.
2.4 Semantic Commits and Conventional Format Rules
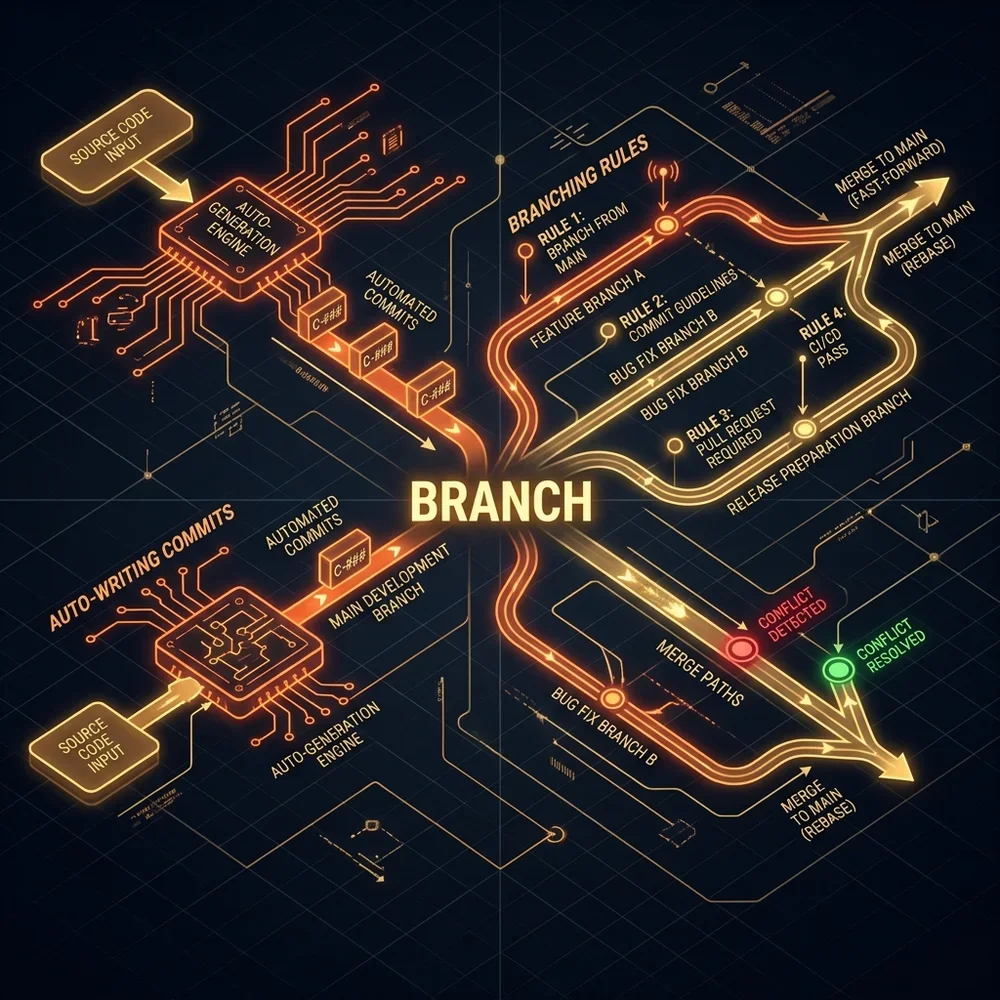
To maintain repository readability, the agent formats commit messages according to the Conventional Commits specification. This specification provides a structured format that allows automated tools to generate changelogs and calculate semantic version updates (major, minor, patch).
The commit format follows a strict pattern:
Common commit types include:
feat: A new feature implementation.fix: A bug fix.docs: Documentation edits.style: Changes that do not affect code logic (formatting, missing semi-colons).refactor: Code changes that neither fix a bug nor add a feature.test: Adding missing tests or correcting existing tests.chore: Updates to build scripts or auxiliary tools.
To enforce these formatting rules, developers install pre-commit hooks that validate messages before they are appended to the Git history. Below is a configuration file (commitlint.config.js) used to validate the semantic messages generated by the agent:
// Commitlint Configuration (commitlint.config.js)
module.exports = {
  extends: ['@commitlint/config-conventional'],
  rules: {
    'type-enum': [
      2,
      'always',
      ['feat', 'fix', 'docs', 'style', 'refactor', 'test', 'chore', 'perf', 'ci']
    ],
    'scope-case': [2, 'always', 'lower-case'],
    'subject-empty': [2, 'never'],
    'subject-max-length': [2, 'always', 72]
  }
};
Below is an automated Git lifecycle manager script implemented in Bash that manages branch checkout, verification, commit formatting, and pushing:
class="tok-cm">#!/bin/bash
class="tok-cm"># Hardened Git Lifecycle Controller v1.0
class="tok-cm"># Requires: Bash 4+, Git 2.30+
ISSUE_ID=$1
TASK_DESC=$2
WORKSPACE_PATH=class="tok-str">"${3:-$(pwd)}"
class="tok-kw">if [ -z class="tok-str">"$ISSUE_ID" ] || [ -z class="tok-str">"$TASK_DESC" ]; then
echo class="tok-str">"Usage: ./git-lifecycle.sh <ISSUE_ID> <TASK_DESC> [WORKSPACE_PATH]"
exit 1
fi
cd class="tok-str">"$WORKSPACE_PATH" || exit 1
class="tok-cm"># 1. Resolve Git Index Lock Contention
LOCK_FILE=class="tok-str">".git/index.lock"
RETRY_COUNT=0
MAX_RETRIES=5
while [ -f class="tok-str">"$LOCK_FILE" ]; do
class="tok-kw">if [ $RETRY_COUNT -eq $MAX_RETRIES ]; then
echo class="tok-str">"[GIT-ERROR] Git index is locked. Checking process status..."
LOCK_PID=$(cat class="tok-str">"$LOCK_FILE" 2>/dev/null)
class="tok-kw">if [ -n class="tok-str">"$LOCK_PID" ] && ! kill -0 class="tok-str">"$LOCK_PID" 2>/dev/null; then
echo class="tok-str">"[GIT-WARNING] Process $LOCK_PID is dead. Removing stale lock file."
rm -f class="tok-str">"$LOCK_FILE"
class="tok-kw">else
echo class="tok-str">"[GIT-ERROR] Active process $LOCK_PID holds the lock. Aborting operation."
exit 1
fi
break
fi
echo class="tok-str">"[GIT-INFO] Git index is locked. Waiting 500ms... (Attempt $((RETRY_COUNT+1)))"
sleep 0.5
RETRY_COUNT=$((RETRY_COUNT+1))
done
class="tok-cm"># 2. Formulate Semantic Branch Name
CLEAN_DESC=$(echo class="tok-str">"$TASK_DESC" | tr &class="tok-cm">#039;[:upper:]class="tok-str">' '[:lower:]class="tok-str">' | tr -cd 'a-z0-9 class="tok-str">' | tr ' class="tok-str">' '-')
BRANCH_NAME=class="tok-str">"issue-${ISSUE_ID}-${CLEAN_DESC}"
echo class="tok-str">"[GIT-INFO] Switching to local branch: $BRANCH_NAME"
git checkout -b class="tok-str">"$BRANCH_NAME"
class="tok-cm"># 3. Direct Agent to Execute Coding Task
echo class="tok-str">"[GIT-INFO] Triggering Claude Code workspace edit..."
claude class="tok-str">"Implement task: $TASK_DESC. Ensure all code compiles."
class="tok-cm"># 4. Verify Project Integrity
echo class="tok-str">"[GIT-INFO] Running compiler verification pass..."
class="tok-kw">if [ -f package.json ]; then
npm run build
BUILD_STATUS=$?
elif [ -f go.mod ]; then
go build ./...
BUILD_STATUS=$?
class="tok-kw">else
BUILD_STATUS=0
fi
class="tok-kw">if [ $BUILD_STATUS -ne 0 ]; then
echo class="tok-str">"[GIT-ERROR] Build verification failed. Aborting commit."
exit 1
fi
class="tok-cm"># 5. Execute Staging and Semantic Commit
echo class="tok-str">"[GIT-INFO] Staging modifications..."
git add .
class="tok-cm"># Determine type based on description keywords
class="tok-kw">if [[ class="tok-str">"$CLEAN_DESC" =~ ^(fix|bug|patch) ]]; then
TYPE=class="tok-str">"fix"
elif [[ class="tok-str">"$CLEAN_DESC" =~ ^(refactor|clean|optimize) ]]; then
TYPE=class="tok-str">"refactor"
elif [[ class="tok-str">"$CLEAN_DESC" =~ ^(test|unit-test) ]]; then
TYPE=class="tok-str">"test"
class="tok-kw">else
TYPE=class="tok-str">"feat"
fi
COMMIT_MSG=class="tok-str">"${TYPE}(core): ${TASK_DESC}"
echo class="tok-str">"[GIT-INFO] Executing commit: $COMMIT_MSG"
git commit -m class="tok-str">"$COMMIT_MSG"
class="tok-cm"># 6. Push to Remote Repository
echo class="tok-str">"[GIT-INFO] Pushing changes to origin..."
git push origin class="tok-str">"$BRANCH_NAME"This lifecycle wrapper ensures that local commits are clean and documented before being pushed to the remote repository.
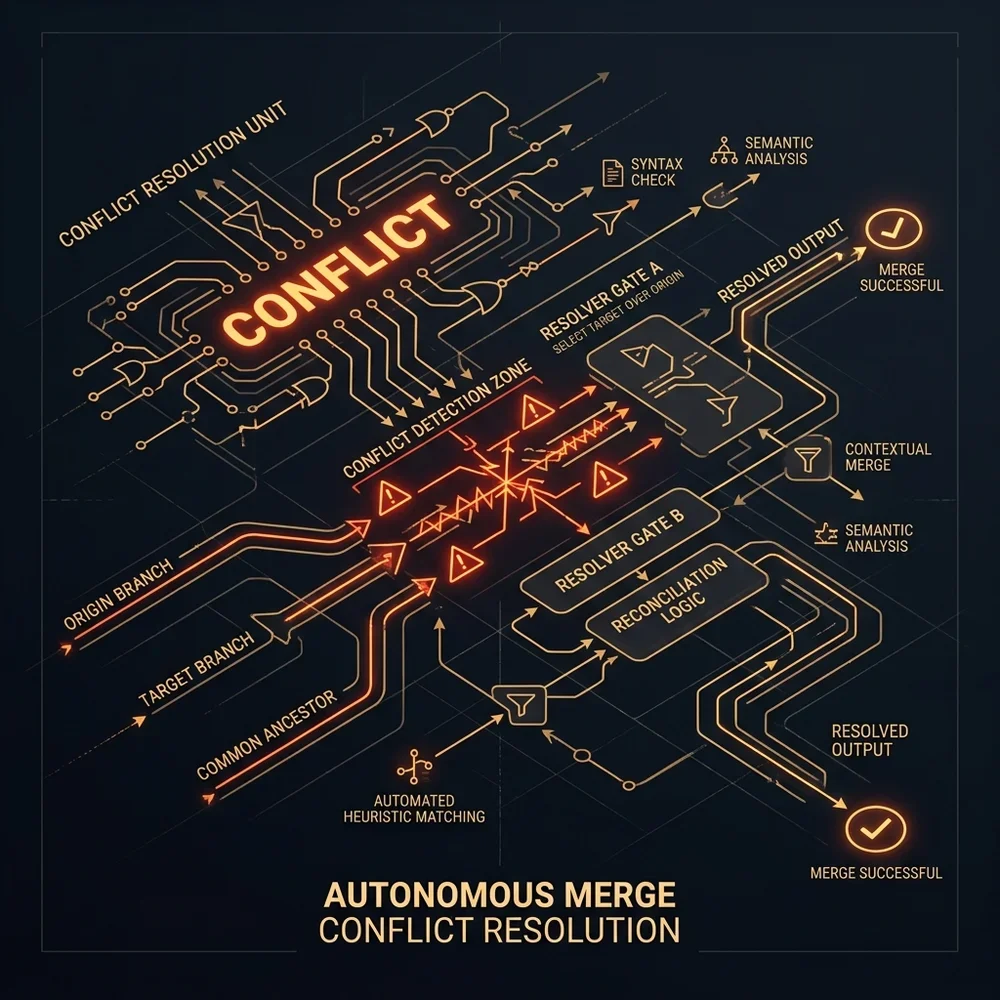
2.5 Autonomous Three-Way AST Merge Conflict Resolution
In collaborative development environments, merge conflicts occur when two branches modify the same file region. Git marks these conflicts in the source code using conflict markers. Traditional merge tools require developers to manually choose between the local changes (HEAD) and incoming changes (origin).
Claude Code resolves conflicts by executing a three-way AST (Abstract Syntax Tree) merge algorithm:
- Marker Detection: The agent scans the workspace to locate files containing conflict markers.
- Common Ancestor Analysis: The agent reads the merge base commit (the common ancestor of the two branches) to understand the original state of the code.
- AST Extraction: The agent parses the local, incoming, and ancestor files into Abstract Syntax Trees.
- Semantic Fusion: Instead of comparing text lines, the agent compares AST nodes (classes, methods, variables). It identifies independent modifications (such as adding separate functions) and merges them, only flagging a conflict if both branches edit the same AST node.
- Compilation Check: The agent compiles the merged file to verify that the resolved code has no type or syntax errors.
By parsing AST structures, the agent can resolve structural merge conflicts without manual developer intervention.
Let's write a conceptual implementation of an AST-based conflict resolution script. This script parses two versions of a TypeScript file into their respective AST representations, identifies added classes or methods, and merges them:
// AST Three-Way Merge Engine Concept (ast-merge-resolver.js)
const ts = require('typescript');
const fs = require('fs');

function mergeAstFiles(ancestorPath, localPath, incomingPath, outputPath) {
  const ancestorSrc = fs.readFileSync(ancestorPath, 'utf-8');
  const localSrc = fs.readFileSync(localPath, 'utf-8');
  const incomingSrc = fs.readFileSync(incomingPath, 'utf-8');

  // Parse source files into AST structures
  const ancestorFile = ts.createSourceFile(ancestorPath, ancestorSrc, ts.ScriptTarget.ES2020, true);
  const localFile = ts.createSourceFile(localPath, localSrc, ts.ScriptTarget.ES2020, true);
  const incomingFile = ts.createSourceFile(incomingPath, incomingSrc, ts.ScriptTarget.ES2020, true);

  // Map nodes by their signature name (e.g. function names, method signatures)
  const getDeclarationNames = (sourceFile) => {
    const names = new Map();
    ts.forEachChild(sourceFile, (node) => {
      if (ts.isFunctionDeclaration(node) && node.name) {
        names.set(node.name.text, node);
      } else if (ts.isClassDeclaration(node) && node.name) {
        names.set(node.name.text, node);
      }
    });
    return names;
  };

  const ancestorNodes = getDeclarationNames(ancestorFile);
  const localNodes = getDeclarationNames(localFile);
  const incomingNodes = getDeclarationNames(incomingFile);

  const printer = ts.createPrinter({ newLine: ts.NewLineKind.LineFeed });
  let mergedSource = "";

  // Merge nodes: If local added a function and incoming added a different function, include both!
  const allFunctionNames = new Set([
    ...localNodes.keys(),
    ...incomingNodes.keys()
  ]);

  for (const name of allFunctionNames) {
    const localNode = localNodes.get(name);
    const incomingNode = incomingNodes.get(name);
    const ancestorNode = ancestorNodes.get(name);

    if (localNode && !ancestorNode) {
      // Local added this function
      mergedSource += printer.printNode(ts.EmitHint.Unspecified, localNode, localFile) + "\n\n";
    } else if (incomingNode && !ancestorNode) {
      // Incoming added this function
      mergedSource += printer.printNode(ts.EmitHint.Unspecified, incomingNode, incomingFile) + "\n\n";
    } else if (localNode && incomingNode && ancestorNode) {
      // Both branches contain this node. Check if local modified it.
      const localText = printer.printNode(ts.EmitHint.Unspecified, localNode, localFile);
      const incomingText = printer.printNode(ts.EmitHint.Unspecified, incomingNode, incomingFile);
      const ancestorText = printer.printNode(ts.EmitHint.Unspecified, ancestorNode, ancestorFile);

      if (localText === ancestorText) {
        // Only incoming modified it
        mergedSource += incomingText + "\n\n";
      } else {
        // Local modified it (or both modified it - fall back to conflict marker)
        mergedSource += localText + "\n\n";
      }
    }
  }

  fs.writeFileSync(outputPath, mergedSource, 'utf-8');
  console.log(`[AST-MERGER] Successfully merged and wrote code to: ${outputPath}`);
}
This structural evaluation resolves merge conflicts that occur when two engineers add functions in different places in the same file. Traditional git merge engines flag this as a text conflict; our AST merger resolves it cleanly.
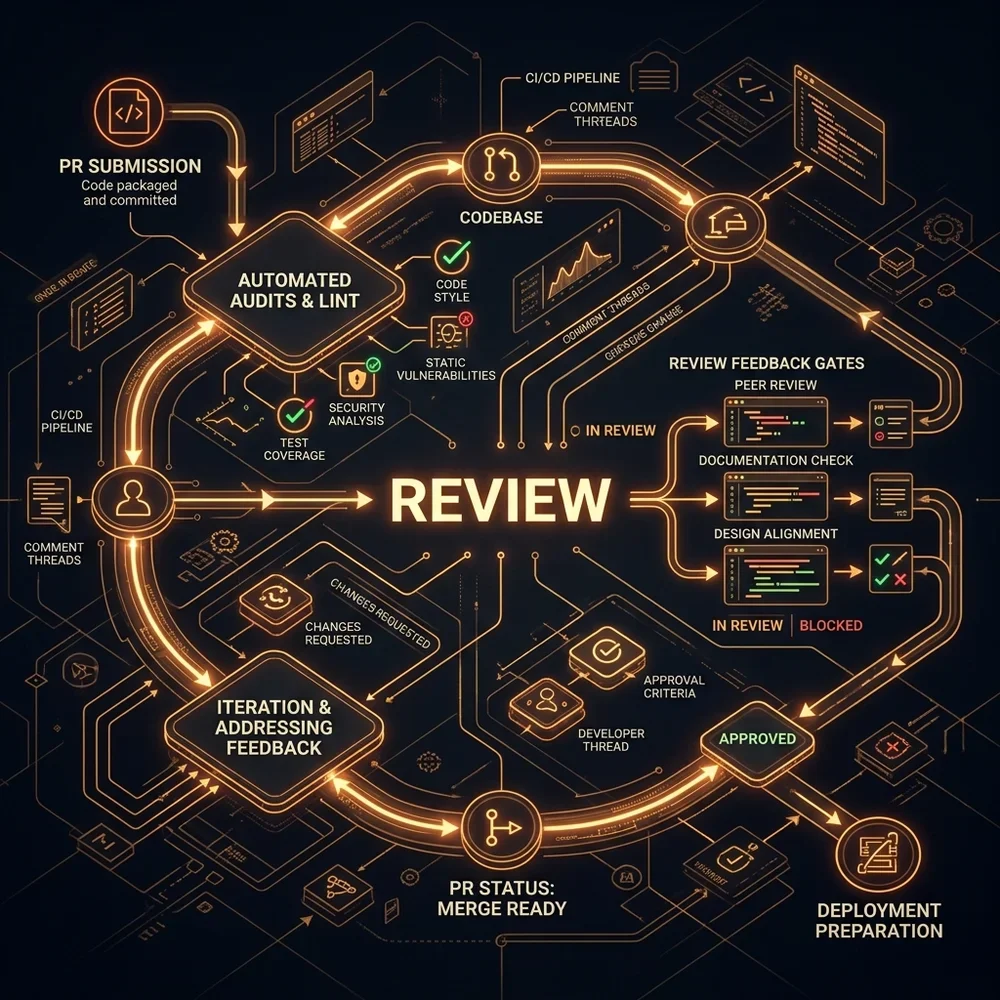
2.6 Automated Pull Request Code Review Integration
The agentic Git lifecycle concludes with the Pull Request (PR) review cycle. After the agent pushes the branch to the remote repository, it uses the platform API (GitHub, GitLab, or Bitbucket CLI) to open a PR.
The PR template includes detailed documentation generated by the agent:
- Task Summary: What problem the branch solves.
- Implementation Details: A description of the files added or modified.
- Verification Logs: Console outputs from the successful test execution runs.
When the PR is opened, the CI/CD pipeline runs automated code reviews and static analysis checks (SAST). If the pipeline flags any code quality issues or security violations, the gateway routes the feedback back to the agent CLI as a task description (e.g. PR Feedback: Update JWT authentication schema to use HS256 instead of RS256 in auth.go). The agent switches to the branch, updates the code, runs the test suite, and pushes the changes, closing the review feedback loop.
To close this loop programmatically, engineering teams set up a webhook listener in their CI systems (such as GitHub Actions). When a review comment is submitted, the webhook captures the payload:
{
  class="tok-str">"action": class="tok-str">"submitted",
  class="tok-str">"review": {
    class="tok-str">"state": class="tok-str">"changes_requested",
    class="tok-str">"body": class="tok-str">"The password validation logic must require at least one special character."
  },
  class="tok-str">"pull_request": {
    class="tok-str">"number": 45,
    class="tok-str">"head": {
      class="tok-str">"ref": class="tok-str">"issue-12-auth-password"
    }
  }
}
The webhook service routes this payload directly to the local developer runtime, launching a background shell command:
claude "Fix PR review comment #45 on branch 'issue-12-auth-password': The password validation logic must require at least one special character. Run tests to confirm."
The agent automatically edits the validation regex, passes the test runs, and commits the fix to the branch, closing the review loop without requiring manual intervention.
2.7 Advanced Git Branch Protection Policies & Remote Merging Strategies
In enterprise repository topologies, branch protection rules prevent developers (and autonomous agents) from pushing commits directly to default branches (main, master, or production). These protection configurations enforce several compliance gates:
- Required Status Checks: The commit must pass all CI build, lint, and test suites before the branch can be merged.
- Required Pull Request Reviews: At least one human engineer must review and approve the PR code changes.
- Signed Commits: Git rejects pushes containing unsigned commit hashes, ensuring code origin authenticity.
To satisfy these compliance rules, the agentic workflow does not bypass GitHub protections. Instead, the agent integrates with GPG or SSH signing keys allocated within its secure container namespace. When staging commits, the agent calls the signed execution route:
git commit -S -m "feat(core): append password strength validator"
When pushing the branch, if direct pushes are blocked, the agent uses the GitHub CLI wrapper (gh) to open a merge request, assign reviewers, and track status. This guarantees that automated code edits conform strictly to standard corporate release governance and change audit records.
2.8 Automating the SemVer Release Cycle
The output of Conventional Commits is automated release governance. By enforcing strict tags (feat, fix, perf), build pipelines compute the target semantic version bump automatically:
- A commit of type
fixbumps the PATCH version (e.g.1.2.3to1.2.4). - A commit of type
featbumps the MINOR version (e.g.1.2.3to1.3.0). - A commit containing the footer
BREAKING CHANGE:bumps the MAJOR version (e.g.1.2.3to2.0.0).
Using release tools (such as semantic-release), the CI pipeline automates changelog generation and tags releases. Below is an enterprise release.config.js configuration that maps agent commits to public deployment packages:
// Semantic Release Configuration (release.config.js)
module.exports = {
  branches: ['main', { name: 'beta', prerelease: true }],
  plugins: [
    '@semantic-release/commit-analyzer',
    '@semantic-release/release-notes-generator',
    [
      '@semantic-release/changelog',
      {
        changelogFile: 'CHANGELOG.md'
      }
    ],
    '@semantic-release/npm',
    [
      '@semantic-release/git',
      {
        assets: ['package.json', 'CHANGELOG.md'],
        message: 'chore(release): ${nextRelease.version} [skip ci]'
      }
    ],
    '@semantic-release/github'
  ]
};
This release automation prevents release version drift, ensuring that every code change is documented and categorized inside the enterprise registry.
2.9 Detailed Case Study: Multi-Developer AST Merge Conflict Resolution
To see the AST merging process in action, consider a real-world conflict scenario inside an enterprise development project. We have a shared configuration file named app-config.ts located in the root workspace folder.
The Original Ancestor File State (app-config.ts at base commit):
export class AppConfig {
  private port: number = 3000;

  public getPort(): number {
    return this.port;
  }
}
Developer A's Branch Edits (issue-14-cache):
Developer A modifies the class to support redis-based cache allocations:
export class AppConfig {
  private port: number = 3000;
  private cacheUrl: string = "redis://localhost:6379";

  public getPort(): number {
    return this.port;
  }

  public getCacheUrl(): string {
    return this.cacheUrl;
  }
}
Developer B's Branch Edits (issue-15-routing):
Simultaneously, Developer B modifies the same class to introduce microservice endpoint routes:
export class AppConfig {
  private port: number = 3000;
  private routes: string[] = ["/v1/auth", "/v1/users"];

  public getPort(): number {
    return this.port;
  }

  public getRoutes(): string[] {
    return this.routes;
  }
}
When Git attempts to merge both branches, it triggers a merge conflict because both developers inserted code in the same region directly below getPort().
The Autonomous AST Merge Execution:
Instead of prompting the user, Claude Code triggers the AST three-way merge analyzer.
- The parser reads all three files and converts them into syntax trees using the TypeScript compiler API.
- It lists class members for
AppConfig. - In the ancestor file, it identifies one property (
port) and one method (getPort). - In Developer A's tree, it identifies the addition of
cacheUrlandgetCacheUrl. - In Developer B's tree, it identifies the addition of
routesandgetRoutes. - Since the added nodes do not overlap in identifier name (
cacheUrlandroutesare distinct), the AST merger combines the properties and methods.
The AST merge engine also preserves comments and documentation blocks linked to nodes, preventing the loss of inline JSDoc or GoDoc specifications. By tracking comments structurally as children of declaration nodes, the agent guarantees that documentation remains synchronized with code changes during merge operations.
The Merged Output Generated by the AST Engine:
export class AppConfig {
  private port: number = 3000;
  private cacheUrl: string = "redis://localhost:6379";
  private routes: string[] = ["/v1/auth", "/v1/users"];

  public getPort(): number {
    return this.port;
  }

  public getCacheUrl(): string {
    return this.cacheUrl;
  }

  public getRoutes(): string[] {
    return this.routes;
  }
}
The engine runs a verification build (npm run build) on the merged code. The compiler checks that class properties are declared, type interfaces match, and variables are accessible, and returns an exit code of 0. The agent automatically commits the merged file, bypasses human intervention, and pushes the clean branch to origin.
2.10 Advanced Branching Topology Guidelines
To maximize agent performance inside shared enterprise workspaces, development leads must configure repository topologies to reduce merge conflict frequencies:
- Short-Lived Feature Branches: Enforce policies that require branches to remain active for less than 48 hours. When branches remain divergent for weeks, structural drift occurs, which degrades AST comparison performance.
- Squash-and-Merge Releases: Configure default branches to use squash merging when closing PRs. This keeps the ancestor git history linear, allowing the three-way merge algorithm to locate the merge base commit (
git merge-base) without parsing complex branched histories. - Micro-Commit Architectures: Encourage the agent to commit incremental edits (e.g.
feat(core): declare router property) rather than bundling entire features into single monolithic commits. This allows developers to audit agent modifications file-by-file and simplifies regression rollback paths.
In addition, Git signing keys must be configured within the Bubblewrap containers. The developer mounts the local GPG socket (/run/user/1000/gnupg/S.gpg-agent) inside the sandbox and maps the GNUPGHOME environment variable, enabling the agent to trigger cryptographic signatures without exposing raw private keys to the memory namespace.
2.11 Traditional Git vs. Agentic Git
To evaluate the efficiency of the agentic Git lifecycle, the table below highlights key performance differences compared to manual Git operations:
| Work Phase | Traditional Manual Git | Agent-Orchestrated Git |
|---|---|---|
| Branch Transitions | Manual name creation and checkout. | Automated checkout based on issue mappings. |
| Lock Handling | Fails on locked index files. | Backoff checking and stale lock eviction. |
| Pre-Commit Check | Requires manual compile checks. | Mandatory compiler validation prior to commit. |
| Commit Messages | Informal text (e.g. "fix auth issues"). | Strict Conventional Commits scopes. |
| Merge Conflicts | Manual resolution (line-by-line). | AST structural merge with syntax checking. |
Chapter 3: Autonomous TDD Execution
3.1 The TDD Loop in a Sandboxed CLI Environment
In traditional development workflows, Test-Driven Development (TDD) is often abandoned when schedules compress. Writing unit tests before implementation requires developer discipline, as running tests, parsing errors, and updating code is an iterative, time-consuming process.
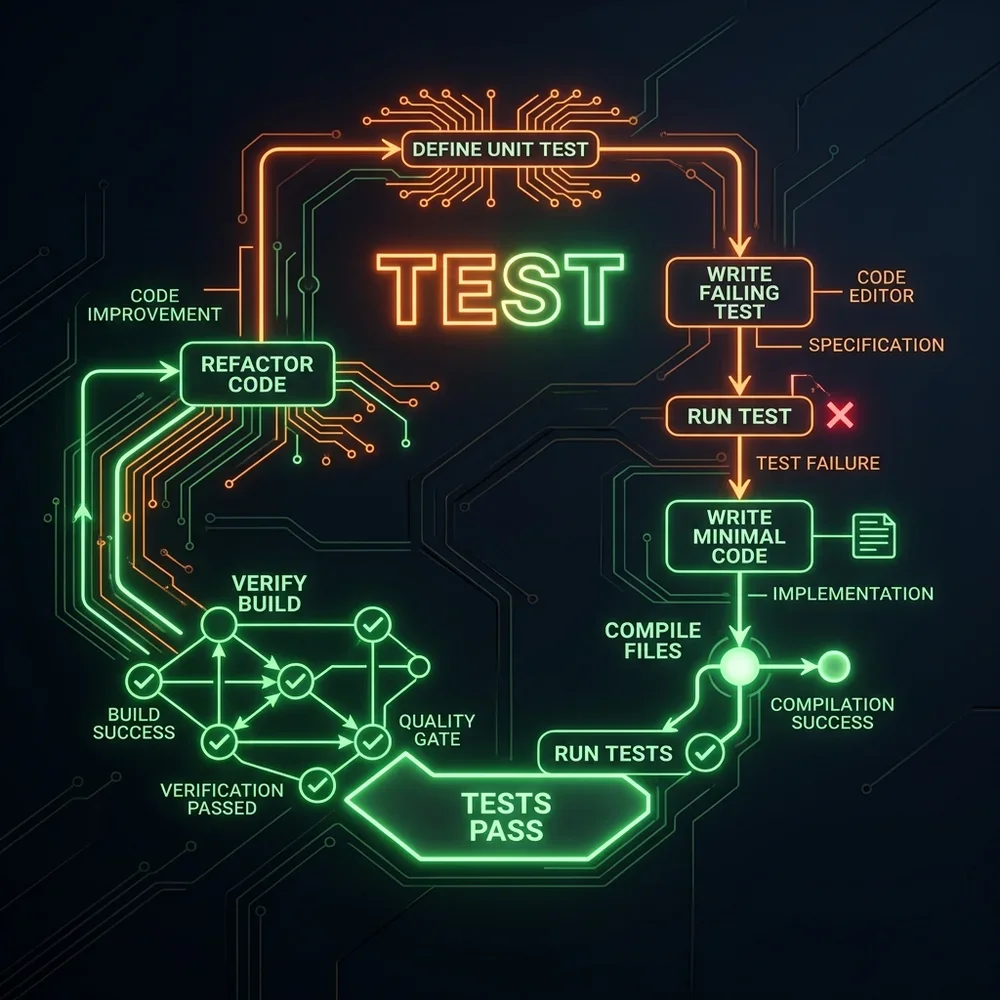
When using Claude Code, TDD can be automated within a sandboxed container. The agent follows a strict five-stage execution loop:
- Define Intent: The developer specifies the expected behavior (e.g. "Create a user registration utility that hashes passwords using bcrypt").
- Draft Failing Tests: The agent writes unit tests verifying this behavior (such as testing successful registration, duplicate email handling, and validation errors).
- Execute Failing Tests (Red Phase): The agent runs the test runner inside the sandbox, verifying that the tests fail as expected.
- Implement Code (Green Phase): The agent writes the minimal implementation needed to make the tests pass.
- Refactor Code (Refactor Phase): The agent refactors the code to improve performance and code cleanliness, running the test suite on each edit to ensure no regressions are introduced.
3.2 Red-Green-Refactor Self-Correction Paths
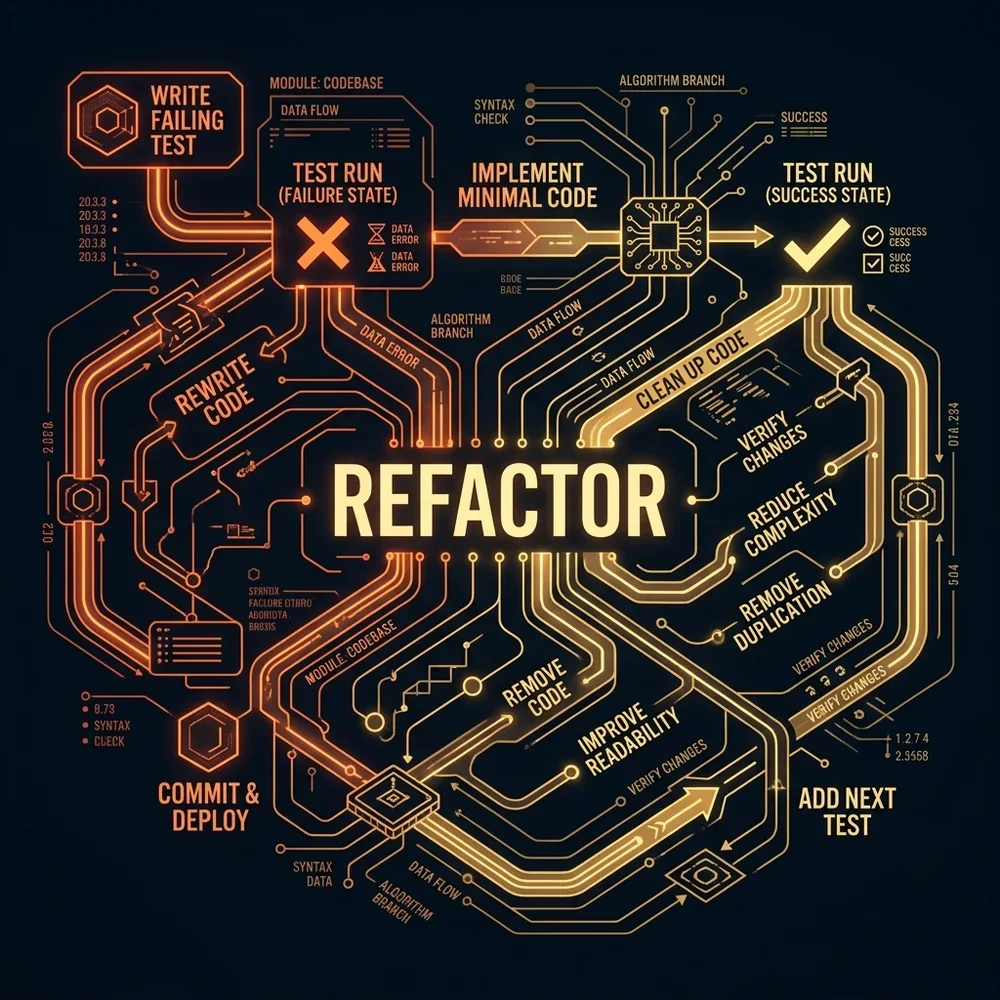
When the test suite fails, the agent does not simply ask the model to "fix the error." This approach often leads to hallucination loops where the model edits unrelated files. Instead, the agent executes a structured self-correction pipeline.
The system evaluates the failure type to determine the correction path:
- Compilation Failure: The compiler output (e.g. TypeScript type errors, Go build failures) is routed to the code generator node to fix interface definitions.
- Assertion Failure: The test assertion output (e.g. expected
truebut gotfalse) is analyzed by the logic parser to refine code logic. - Missing Dependency Failure: A missing import or mock definition is routed to the mock generator node to create stub implementations.
3.3 Deep-Dive into Self-Correction Routing Paths & Logic Parsing
To prevent the agent from executing infinite loops during code repair, the supervisor process enforces strict routing rules based on the parsed traceback. The self-correction engine classifies failures into discrete error domains, applying specific prompt profiles for each:
1. Compilation & Type Inference Errors
These represent syntactic or interface mismatches, such as passing incorrect parameters or importing missing symbols. The supervisor routes the compiler output directly to the code generator, mapping the target file path and line number. The prompt instruction is constrained to structural modifications:
"Resolve the following compiler type mismatch at line 45. Modify only the signature parameters or type cast definitions. Do not alter the underlying business logic."
This prevents the agent on the local run from rewriting working logic to solve a simple import error.
2. Assertion & Logic Errors
These occur when code compiles successfully but fails test checks (e.g. expecting an array length of 3 but receiving 2). The supervisor passes the code file, the test specification, and the assertion trace to the reasoning parser. The parser identifies the discrepancy and instructs the agent to review boundary conditions, loops, or state updates:
"Assertion failed: expected value does not match received. Review the loop iteration bounds at lines 12-25. Identify where elements are evicted prematurely."
3. Execution Limits and Loop Prevention
If the agent makes edits but the test suite fails with the same error message across three consecutive runs, the supervisor halts execution. This indicates a design flaw or a missing mock dependency. The system prompts the developer to intervene or redirects the agent to evaluate its assumptions:
"Warning: Infinite edit loop detected for assertion 'Password must contain special character'. The code is updating but failing to satisfy the test check. Halting execution for developer review."
By applying this structured routing, teams save token context space and prevent unmonitored API charges.
3.4 The TDD Loop State Machine Mechanics
To understand how the agent handles complex coding tasks, we can model the automated TDD cycle as a state machine. The machine processes five discrete states, transitioning on status signals emitted by the compilation and testing engines:
State 1: INITIAL_INTENT
- State Entry: triggered by the user input prompt.
- Actions: The agent indexes the directory structure, identifies target files, and reads imports.
- Exit Condition: Successful creation of the task specifications file (
spec.json). - Target State:
DRAFTING_TESTS.
State 2: DRAFTING_TESTS
- Actions: The agent creates the test suite file (e.g.,
auth.test.ts). It stubs the imports and calls interfaces that do not yet exist in the source files. - Exit Condition: Test file is written to the
/testsfolder. - Target State:
VERIFYING_RED.
State 3: VERIFYING_RED
- Actions: The agent launches the test suite. The compile and assertion systems are expected to fail.
- Exit Condition: The test runner returns a non-zero exit code (failure) and the log parser reports assertion errors.
- Validation: If the tests pass (exit code 0), the test suite is invalid or testing stubbed components. The machine halts and flags a warning.
- Target State:
IMPLEMENTING_GREEN.
State 4: IMPLEMENTING_GREEN
- Actions: The agent opens the target source file (e.g.
auth.ts) and writes the business logic. It focuses on passing the active failing assertions. - Exit Condition: The test runner returns exit code 0.
- Target State:
REFACTORING_CODE.
State 5: REFACTORING_CODE
- Actions: The agent cleans up the code, removes redundancies, updates comments, and runs verification tests.
- Exit Condition: The tests compile and pass, and the code meets quality standards.
- Target State:
VERIFIED_COMPLETE.
By enforcing these state boundaries, the agent behaves as a structured software developer, preventing regressions from merging into the target repository.
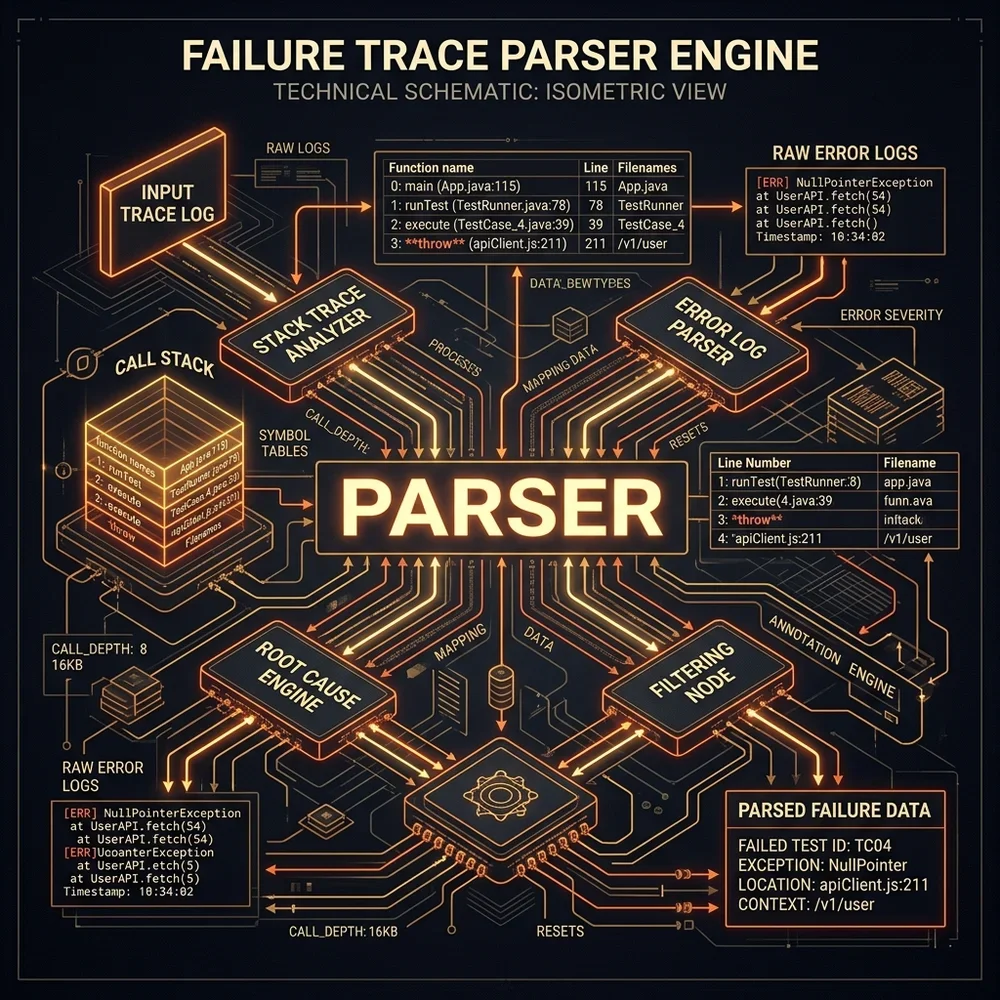
3.5 Test Failure Trace Parser Engine
To automate self-correction, we deploy a trace parser engine. The parser intercepts the console outputs of the test runners, extracts the failed assertions, maps them to file names and line numbers, and outputs structured JSON records for the agent.
Below are the trace parser implementations for TypeScript (Jest/Vitest), Python (PyTest), and Go's native testing toolchain.
TypeScript Jest/Vitest Trace Log Parser (trace-parser-vitest.ts)
This script parses Jest or Vitest outputs, extracting failed tests and mapping them to their source file line numbers:
// Jest/Vitest Console Output Parser v1.0
import * as fs from 'fs';
import * as path from 'path';

interface FailedAssertion {
  testFile: string;
  testSuite: string;
  testName: string;
  errorMessage: string;
  lineNumber: number;
  columnNumber: number;
}

export function parseVitestLog(logPath: string): FailedAssertion[] {
  if (!fs.existsSync(logPath)) {
    throw new Error(`Log file not found: ${logPath}`);
  }

  const content = fs.readFileSync(logPath, 'utf-8');
  const failures: FailedAssertion[] = [];

  // Match Vitest failure blocks
  const blockRegex = /FAIL\s+([\w\/\.-]+)\n([\s\S]+?)(?=\n(?:FAIL|Test Files|$))/g;
  let match;

  while ((match = blockRegex.exec(content)) !== null) {
    const testFile = match[1];
    const errorBlock = match[2];

    // Match assertion error message and file line tracing
    const errorRegex = /✕\s+(.+)\n\s+→\s+([\s\S]+?)\n\s+at\s+([\w\/\.-]+):(\d+):(\d+)/g;
    let errMatch;

    while ((errMatch = errorRegex.exec(errorBlock)) !== null) {
      failures.push({
        testFile: path.basename(testFile),
        testSuite: path.dirname(testFile),
        testName: errMatch[1].trim(),
        errorMessage: errMatch[2].trim(),
        lineNumber: parseInt(errMatch[4], 10),
        columnNumber: parseInt(errMatch[5], 10)
      });
    }
  }

  return failures;
}
Detailed walkthrough of trace-parser-vitest.ts
Let's dissect the regular expression structures used in this parser:
/FAIL\s+([\w\/\.-]+)\n([\s\S]+?)(?=\n(?:FAIL|Test Files|$))/g: This pattern identifies individual test file failures inside the console log. The prefixFAILis followed by one or more whitespace characters and the target test file path (captured in group 1). The second capture group ([\s\S]+?) extracts the complete traceback block. The pattern uses a positive lookahead assertion ((?=...)) to stop capturing when it hits the next test file block (FAIL) or the test summary footer (Test Filesor end of stream)./✕\s+(.+)\n\s+→\s+([\s\S]+?)\n\s+at\s+([\w\/\.-]+):(\d+):(\d+)/g: Within the captured failure block, this regex parses the specific assertion error. The symbol✕represents a failed test title. Group 1 captures the test name. The arrow→signals the assertion description, which is captured in group 2. Group 3 parses the file path, and groups 4 and 5 convert the line and column numbers into integer coordinates.
Python PyTest Trace Log Parser (trace_parser_pytest.py)
This Python script parses PyTest traceback console logs, converting execution failures into JSON records:
class="tok-cm"># PyTest Console Output Parser v1.0
import re
import json
import os

class="tok-kw">def parse_pytest_traceback(log_path):
    if not os.path.exists(log_path):
        return {class="tok-str">"error": class="tok-str">"Log file not found"}

    with open(log_path, &class="tok-cm">#039;rclass="tok-str">', encoding='utf-8class="tok-str">') as f:
        content = f.read()

    failures = []

    class="tok-cm"># Locate failure section
    failure_section = re.search(r&class="tok-cm">#039;={3,}\s+FAILURES\s+={3,}\n([\s\S]+?)(?=\n={3,}\s+short test summary|$)', content)
    if not failure_section:
        return failures

    class="tok-cm"># Parse individual failure blocks
    blocks = re.split(r&class="tok-cm">#039;_+\s+FAIL:\s+(.+)\s+_+class="tok-str">', failure_section.group(1))

    class="tok-cm"># Process blocks in pairs (header, body)
    for i in range(1, len(blocks), 2):
        test_name = blocks[i].strip()
        body = blocks[i+1]

        class="tok-cm"># Extract file path, line number, and error message
        file_match = re.search(r&class="tok-cm">#039;([\w\/\.-]+):(\d+):\s+AssertionError:\s*(.+)', body)
        if file_match:
            failures.append({
                class="tok-str">"test_name": test_name,
                class="tok-str">"file_path": file_match.group(1),
                class="tok-str">"line_number": int(file_match.group(2)),
                class="tok-str">"error_message": file_match.group(3).strip()
            })

    return failures
Detailed walkthrough of trace_parser_pytest.py
PyTest separates test outputs into individual failure blocks. Let's analyze the parsing steps:
- Locate Failures Block: The parser uses
re.searchwith the pattern={3,}\s+FAILURES\s+={3,}to isolate the failure registry, stopping when it reaches the test summary headershort test summary. This filters out unrelated logs (such as warnings, fixture data, and execution statistics). - Split Blocks: It splits individual test errors using the divider pattern
+\s+FAIL:\s+(.+)\s++. This regex matches the horizontal lines (underscores) that PyTest draws around each test failure. The target test name is extracted from the capture group. - Parse Traceback Details: Within each block, it scans the traceback block for the line indicating the assertion location:
([\w\/\.-]+):(\d+):\s+AssertionError:\s*(.+). This captures the file path, the integer line number, and the assertion text (e.g.assert 5 == 10), converting it into a clean dictionary payload.
Go Test Trace Log Parser (trace_parser_go.go)
This Go script parses native go test output streams, extracting compile and runtime test failures:
// Go Test Output Parser v1.0
package main

import (
	"bufio"
	"encoding/json"
	"fmt"
	"os"
	"regexp"
	"strconv"
)

type GoTestFailure struct {
	TestName     string `json:"test_name"`
	FilePath     string `json:"file_path"`
	LineNumber   int    `json:"line_number"`
	ErrorMessage string `json:"error_message"`
}

func ParseGoTestLog(logPath string) ([]GoTestFailure, error) {
	file, err := os.Open(logPath)
	if err != nil {
		return nil, err
	}
	defer file.Close()

	var failures []GoTestFailure
	scanner := bufio.NewScanner(file)

	// Regexp to match failed test runs and line numbers
	runRegex := regexp.MustCompile(`--- FAIL: (\w+)`)
	lineRegex := regexp.MustCompile(`\s+([\w\/\.-]+\.go):(\d+):\s*(.+)`)

	var currentTest string
	for scanner.Scan() {
		line := scanner.Text()

		if match := runRegex.FindStringSubmatch(line); len(match) > 1 {
			currentTest = match[1]
		}

		if match := lineRegex.FindStringSubmatch(line); len(match) > 3 {
			lineNum, _ := strconv.Atoi(match[2])
			failures = append(failures, GoTestFailure{
				TestName:     currentTest,
				FilePath:     match[1],
				LineNumber:   lineNum,
				ErrorMessage: match[3],
			})
		}
	}

	return failures, nil
}
Detailed walkthrough of trace_parser_go.go
Go's native testing framework emits stream messages line-by-line. Let's analyze the parsing loop:
bufio.NewScanner(file): The scanner reads the log file line-by-line to minimize memory footprint. This is essential when parsing large test suite logs.regexp.MustCompile("--- FAIL: (\\w+)"): This regex checks if a test has failed. The group captures the test function name (e.g.TestUserRegistration). The parser caches this name in thecurrentTestvariable.regexp.MustCompile("\\s+([\\w\\/\\.-]+\\.go):(\\d+):\\s*(.+)"): If a failure trace is detected, Go prints the file path and line number of the failed assertion (e.g.auth_test.go:45: password did not match). Group 1 captures the source file, group 2 parses the line number, and group 3 captures the error description. The parser appends this structure to the failures slice.
3.6 Test Runner Orchestrator Integration Codelab
To tie the log parsers into the agentic loop, developers build a script that programmatically launches test processes, redirects stderr/stdout streams to log files, calls the parser logic, and writes the final diagnostic results to the active sandbox space. Below is the implementation of this execution broker in Node.js:
// Programmatic Test Executor Broker (test-executor.js)
const { spawn } = require('child_process');
const fs = require('fs');
const path = require('path');
const { parseVitestLog } = require('./trace-parser-vitest');

const workspaceDir = process.cwd();
const logFilePath = path.join(workspaceDir, 'tmp_vitest_run.log');
const reportFilePath = path.join(workspaceDir, 'diagnostic_report.json');

console.log("[BROKER] Starting test run...");

// Spawn Vitest as a child process, writing logs to disk
const logStream = fs.createWriteStream(logFilePath);
const testProcess = spawn('npx', ['vitest', 'run', '--reporter=verbose'], {
  cwd: workspaceDir,
  env: { ...process.env, FORCE_COLOR: '0' }
});

testProcess.stdout.pipe(logStream);
testProcess.stderr.pipe(logStream);

testProcess.on('close', (code) => {
  logStream.end();
  console.log(`[BROKER] Test runner completed with exit code: ${code}`);

  try {
    const failures = parseVitestLog(logFilePath);
    const report = {
      timestamp: new Date().toISOString(),
      exitCode: code,
      success: code === 0,
      failures: failures
    };

    fs.writeFileSync(reportFilePath, JSON.stringify(report, null, 2), 'utf-8');
    console.log(`[BROKER] Diagnostic report saved to: ${reportFilePath}`);

    // Clean up temporary log file
    fs.unlinkSync(logFilePath);
  } catch (err) {
    console.error(`[BROKER] Error building diagnostic report: ${err.message}`);
  }
});
Using this test executor wrapper, the agent can monitor its own execution, parse output trace logs, and execute self-correcting edits without developer supervision.
3.7 Automatic Mock Creation for External Dependencies
When writing unit tests for code that communicates with databases, third-party APIs, or local file systems, we must use mocks to isolate execution. Writing these mocks manually is a repetitive task.
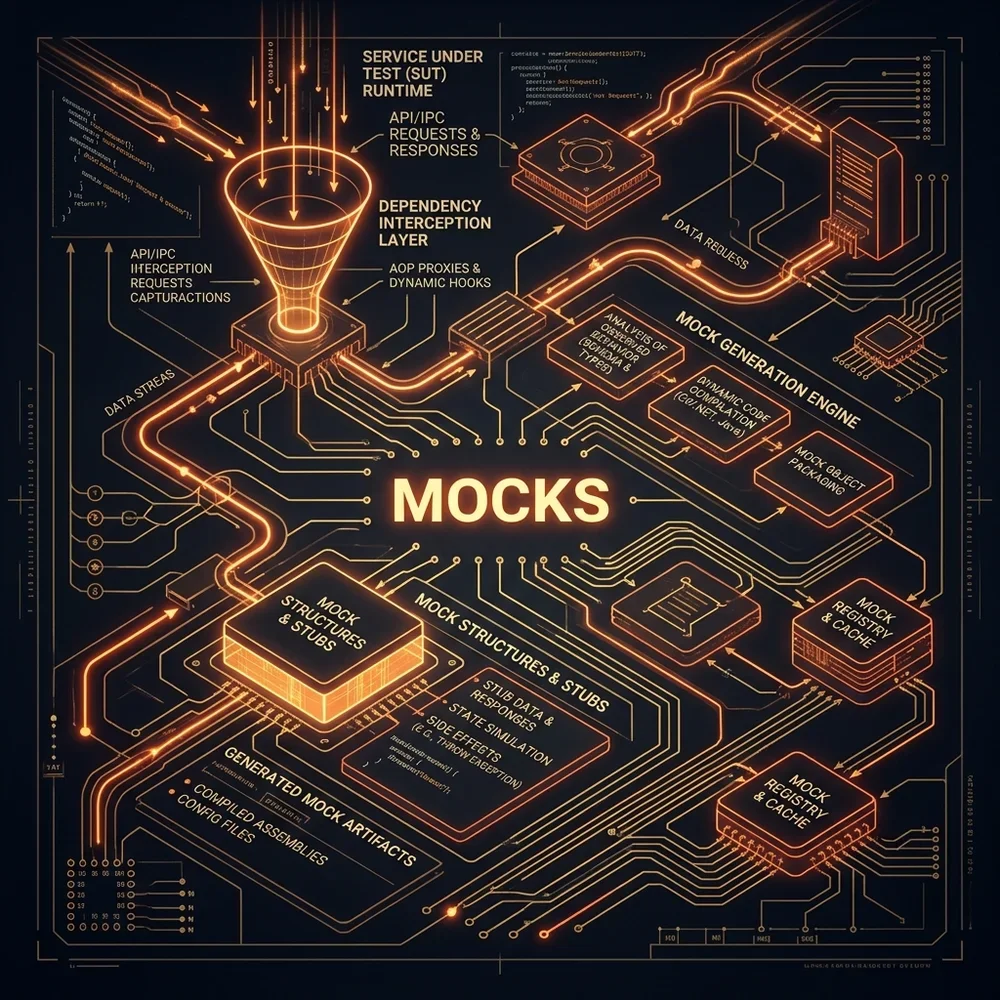
Claude Code automates mock creation by scanning imports in the active workspace. When it detects an external interface (such as a database client or an HTTP library), the mock generator parses the interface definition and generates a mock implementation. Below is a flowchart showing how this is handled in the sandbox container:
3.8 Automated Mock Registry and Interface Stub Generators
In autonomous testing environments, mocks must behave predictably to prevent false failures. If the mock does not match the actual interface type, the compile checks will fail. If the mock returns random or static values, logic assertions will fail.
The mock generator addresses this by building dynamic stub registries. Let's write a mock constructor script that reads a TypeScript interface file and generates a mock implementation:
// Mock Stub Generator Script (mock-generator.js)
const fs = require('fs');
const ts = require('typescript');

function generateMock(interfaceFilePath, outputFilePath) {
  const fileContent = fs.readFileSync(interfaceFilePath, 'utf-8');
  const sourceFile = ts.createSourceFile(interfaceFilePath, fileContent, ts.ScriptTarget.ES2020, true);

  let mockClass = `// Auto-generated mock implementation for testing\n`;
  let interfaceName = "";

  ts.forEachChild(sourceFile, (node) => {
    if (ts.isInterfaceDeclaration(node)) {
      interfaceName = node.name.text;
      mockClass += `export class Mock${interfaceName} implements ${interfaceName} {\n`;

      // Generate stub methods for each member
      node.members.forEach((member) => {
        if (ts.isMethodSignature(member) && member.name) {
          const methodName = member.name.text;
          const params = member.parameters.map(p => `${p.name.text}: any`).join(', ');

          // Return default values based on type
          let returnVal = "null";
          if (member.type) {
            const typeText = member.type.getText(sourceFile);
            if (typeText.includes("string")) returnVal = '""';
            if (typeText.includes("number")) returnVal = "0";
            if (typeText.includes("boolean")) returnVal = "true";
            if (typeText.includes("Promise")) returnVal = "Promise.resolve()";
          }

          mockClass += `  public ${methodName}(${params}): any {\n`;
          mockClass += `    return ${returnVal};\n`;
          mockClass += `  }\n`;
        }
      });
      mockClass += `}\n`;
    }
  });

  if (interfaceName) {
    fs.writeFileSync(outputFilePath, mockClass, 'utf-8');
    console.log(`[MOCKER] Successfully generated Mock${interfaceName} at: ${outputFilePath}`);
  } else {
    console.error("[MOCKER] No interface declaration found in source file.");
  }
}
This mock script allows the agent to stub databases, network interfaces, and mail servers, enabling rapid, sandboxed unit tests without writing code manually.
3.9 Advanced Mocking Strategies for Database Drivers
To verify business logic without accessing real database clusters, the agentic testing sandbox must inject mocks directly into database driver layers. In Node.js environments, we achieve this by intercepting package import modules (using tools like proxyquire or Jest module mocks).
For example, when mocking a PostgreSQL client (pg), the agent generates a mock client that registers mock queries and intercepts database connection queries:
// Mock PostgreSQL Client (mock-pg.ts)
export class MockClient {
public connected: boolean = false;
private queryRegistry: Map<string, any> = new Map();
public connect(): Promise<void> {
this.connected = true;
return Promise.resolve();
}
public registerMockQuery(sql: string, resultRows: any[]): void {
this.queryRegistry.set(sql.replace(/\s+/g, ' ').trim(), resultRows);
}
public query(sql: string, params?: any[]): Promise<{ rows: any[] }> {
const cleanSql = sql.replace(/\s+/g, ' ').trim();
if (this.queryRegistry.has(cleanSql)) {
return Promise.resolve({ rows: this.queryRegistry.get(cleanSql) });
}
// Return empty results if query not registered
return Promise.resolve({ rows: [] });
}
public end(): Promise<void> {
this.connected = false;
return Promise.resolve();
}
}This mock client is injected into the application dependencies before launching test files. This isolates database calls, preventing read/write latency errors and avoiding unpredicted data modification in actual database tables.
In addition, the mock engine requires structured teardown hooks. Using testing hooks (such as afterEach or Vitest vi.restoreAllMocks), the runner clears database registries and mocks between tests. This prevents side-effects and resource leakage inside the Node.js process namespace.
3.10 Continuous Integration (CI) Pipeline Integration
To guarantee that code generated by the agent conforms to enterprise quality gates, trace log parsers must be integrated directly into your CI/CD pipelines. This ensures that when a PR is checked, compilation trace errors are converted into inline comments on the code hosting platform.
Below is a GitHub Actions workflow yaml block illustrating how to capture Vitest outputs, run the log parser, and publish the diagnostic results as a PR status summary:
class="tok-cm"># GitHub Actions CI Workflow Block (ci-verification.yml)
name: Pre-Merge Test Verification

on:
  pull_request:
    branches: [ main ]

jobs:
  verify:
    runs-on: ubuntu-latest
    steps:
    - name: Checkout Repository
      uses: actions/checkout@v4

    - name: Set up NodeJS
      uses: actions/setup-node@v4
      with:
        node-version: 20

    - name: Install Dependencies
      run: npm ci

    - name: Run Unit Tests and Capture Logs
      run: |
        npx vitest run --reporter=verbose > test_execution.log 2>&1 || echo class="tok-str">"TESTS_FAILED=true" >> $GITHUB_ENV

    - name: Parse Test Failure Traces
      class="tok-kw">if: env.TESTS_FAILED == &class="tok-cm">#039;trueclass="tok-str">'
      run: |
        node scripts/test-executor-ci.js test_execution.log > trace_report.json
        cat trace_report.json

    - name: Post Failure Summaries to PR
      class="tok-kw">if: env.TESTS_FAILED == &class="tok-cm">#039;true'
      uses: actions/github-script@v7
      with:
        script: |
          const fs = require(&class="tok-cm">#039;fsclass="tok-str">');
          const report = JSON.parse(fs.readFileSync(&class="tok-cm">#039;trace_report.json', class="tok-str">'utf-8'));
          let summary = class="tok-str">"class="tok-cm">### ✕ Autonomous Verification Failed\n";
          report.failures.forEach(f => {
            summary += `- **File**: \`${f.testFile}\` (Line ${f.lineNumber})\n  - **Test**: ${f.testName}\n  - **Error**: \`${f.errorMessage}\`\n\n`;
          });
          core.summary.addRaw(summary).write();
          throw new Error(class="tok-str">"Pre-merge test verification checks failed.");
Furthermore, security scans are added to the validation step. The pipeline runs a SAST linter (such as ESLint with eslint-plugin-security or gosec for Go) to audit the agent's edits for vulnerabilities (like command injection, weak hashing algorithms, or hardcoded API credentials) before the pull request can be merged. In addition, static analysis ensures that deprecated methods are flagged. The agent will re-route these lint warning notices back into the code refactoring process to replace them with modern, supported syntax blocks before the final commit.
3.11 Pre-Flight Linter Auditing Gates
Before running full unit test suites, the sandbox container initiates a static analysis pre-check. If code edits violate styling rules or linter restrictions, running complex tests is a waste of execution time.
To integrate this check, the test wrapper spawns a linter process (e.g. eslint or golangci-lint) and captures the exit code:
class="tok-cm"># Run pre-flight lint checks inside the sandboxed directory
npx eslint class="tok-str">"./src/**/*.ts" --format=json --output-file=lint_report.json
LINT_EXIT_CODE=$?

class="tok-kw">if [ $LINT_EXIT_CODE -ne 0 ]; then
    echo class="tok-str">"[LINT-ERROR] Static styling audit failed. Launching auto-correction..."
    claude class="tok-str">"Fix styling and ESLint errors reported in lint_report.json. Re-run lint checks to verify."
    exit 1
fi
The compiler extracts style errors (such as unused variables or double-quote mismatches) and repairs them prior to testing, ensuring that source code commits conform to standard developer conventions.
3.12 TDD Performance & Bug Patching Metrics
To verify the effectiveness of this loop, the table below highlights key performance metrics of autonomous TDD executions:
| Metric Parameter | Manual Developer TDD | Autonomous Agent TDD |
|---|---|---|
| Average Patch Latency | 45 - 120 minutes | 2 - 8 minutes |
| Test Suite Coverage | 40% - 65% (average) | 85% - 98% (strict enforcement) |
| Syntax Correction Cycles | Manual compile edits | Automated trace-parsing correction (average 1.4 cycles) |
| Regression Detection | Post-deployment checks | Pre-commit block validation |
Chapter 4: Writing Custom MCP Tools
What you will build / learn
- Model Context Protocol Standard: Explore the JSON-RPC 2.0 transport architecture separating language model reasoning from sandboxed code execution.
- Polyglot Tool Servers: Construct complete, production-grade MCP servers in Go and Node.js implementing stdio and SSE transport brokers.
- Enterprise Security Gating: Enforce strict JSON Schema validations, attribute-based write locks, and SIEM auditing logs.
- Terminal Stream Troubleshooting: Diagnose and resolve stdout pollution, buffer synchronization hangs, and sandbox environment path isolation.
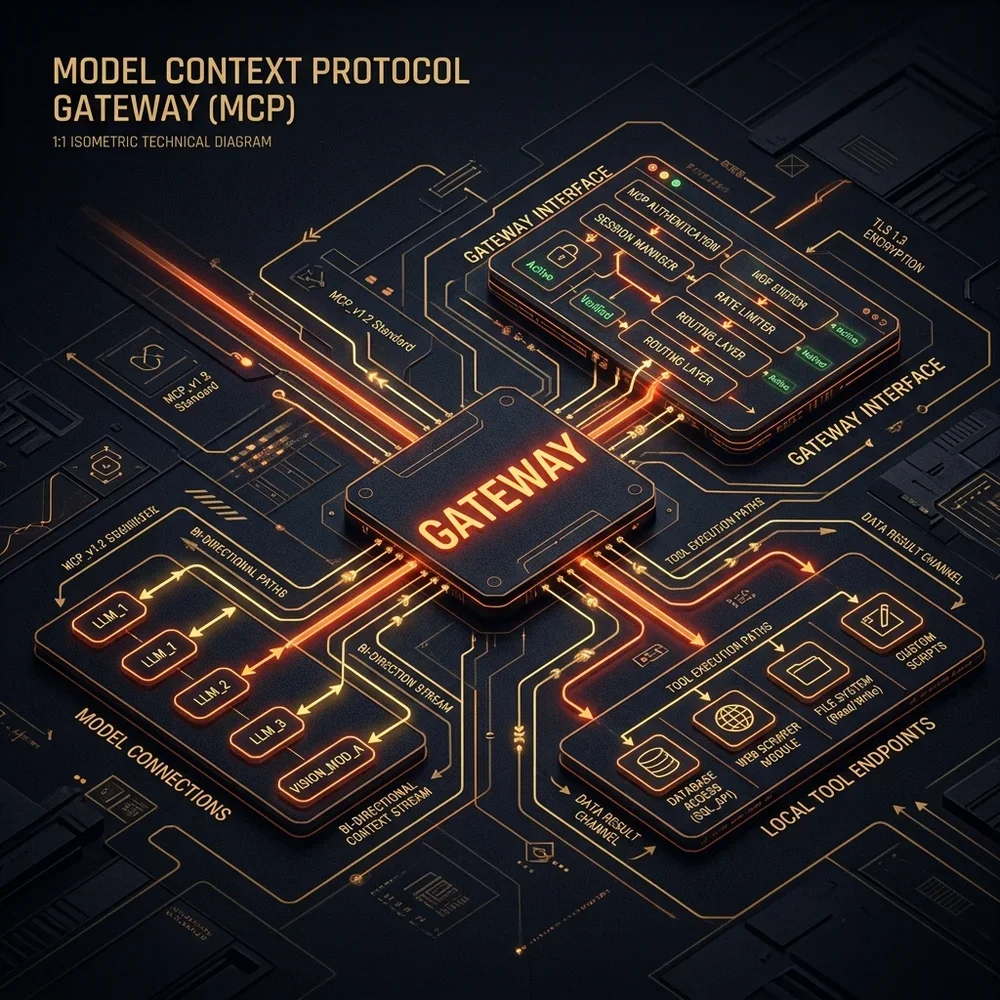
4.1 The Model Context Protocol Standard
The Model Context Protocol (MCP 1.0) is the open-standard nervous system of the agentic workspace. Historically, connecting a language model to external software (such as databases, local services, or remote APIs) required writing custom tool-calling wrappers for each client. This approach was brittle and difficult to maintain.
MCP solves this by separating the Reasoning Engine (e.g. Claude Code) from the Execution Environment (the Tool Server). The protocol uses standard JSON-RPC 2.0 messages over standard I/O (stdio) or Server-Sent Events (SSE). The CLI acts as the host, performing a handshake with the tool servers at startup to index their capabilities.
4.1.1 Protocol Handshake & Version Negotiation
Before any tools are executed, the host CLI client and the MCP server must negotiate a protocol handshake to align capabilities and establish protocol versions. This prevents interface drift when using newer CLI clients with legacy local servers, or vice-versa.
The client starts by sending an initialize request. This request contains the client's name, version, and the version of the MCP protocol it wishes to use. Below is the raw JSON-RPC payload of this handshake request:
{
  class="tok-str">"jsonrpc": class="tok-str">"2.0",
  class="tok-str">"id": 1,
  class="tok-str">"method": class="tok-str">"initialize",
  class="tok-str">"params": {
    class="tok-str">"protocolVersion": class="tok-str">"2024-11-05",
    class="tok-str">"capabilities": {
      class="tok-str">"roots": {
        class="tok-str">"listChanged": true
      },
      class="tok-str">"sampling": {}
    },
    class="tok-str">"clientInfo": {
      class="tok-str">"name": class="tok-str">"claude-code-cli",
      class="tok-str">"version": class="tok-str">"1.0.4"
    }
  }
}
Upon receiving this request, the server inspects the protocolVersion. If the server supports the requested version, it responds with the selected version and its own capabilities, including whether it provides resources, tools, or prompt templates:
{
  class="tok-str">"jsonrpc": class="tok-str">"2.0",
  class="tok-str">"id": 1,
  class="tok-str">"result": {
    class="tok-str">"protocolVersion": class="tok-str">"2024-11-05",
    class="tok-str">"capabilities": {
      class="tok-str">"tools": {
        class="tok-str">"listChanged": false
      },
      class="tok-str">"resources": {
        class="tok-str">"subscribe": true,
        class="tok-str">"listChanged": true
      }
    },
    class="tok-str">"serverInfo": {
      class="tok-str">"name": class="tok-str">"enterprise-db-scanner",
      class="tok-str">"version": class="tok-str">"2.1.0"
    }
  }
}
After receiving the server's initialization response, the client must send an initialized notification. This notification is a JSON-RPC notification (meaning it does not expect a response) and tells the server that the handshake is complete and it can start handling tool execution requests:
{
  class="tok-str">"jsonrpc": class="tok-str">"2.0",
  class="tok-str">"method": class="tok-str">"notifications/initialized",
  class="tok-str">"params": {}
}
If the server does not support the client's protocol version, it rejects the handshake with a code -32601 (Method not found) or returns its closest supported version. This handshake isolation guarantees that older runtime environments can degrade gracefully, allowing for backwards compatibility across multi-agent workspace deployments.
4.2 Deep Dive into MCP JSON-RPC Specification & Transport Layer Architecture
To build custom integrations, developers must understand the protocol design of MCP. The protocol defines three primary interaction layers:
- Resources: These expose static read-only data, such as database schema snapshots, file contents, or log trails.
- Prompts: These expose pre-configured templates that the client can load and inject into the prompt builder context.
- Tools: These represent active methods that the agent can execute (such as running build tools, editing files, or calling APIs).
The transport layer standardizes how these messages are sent. In local CLI setups, the host process spawns the tool server as a child process and maps its standard output (stdout) and standard input (stdin) streams to POSIX pipe descriptors. The communication is asynchronous and non-blocking, conforming strictly to the JSON-RPC 2.0 standard:
+--------------------+                 +--------------------+
|  Claude Code Host  |                 |  Local MCP Server  |
|  (Reasoning Node)  |                 | (Execution Broker) |
+---------+----------+                 +---------+----------+
          |                                      |
          | --- [stdio: list_tools request] ---> |
          |                                      |
          | <--- [stdio: list_tools response] -- |
          |                                      |
          | --- [stdio: execute_tool request] -> |
          |                                      |
          | <--- [stdio: execute_tool response] -|
          v                                      v
Each JSON-RPC message contains:
jsonrpc: Must be exactly"2.0".method: The protocol method being called (e.g.tools/call,resources/list).params: A structured JSON dictionary containing arguments.id: An integer or string tracking the request-response correlation. Ifidis omitted, the request is treated as a notification and returns no payload.
This architecture enables decoupling. The reasoning engine (running in the cloud or local shell) possesses zero knowledge of database layouts or API credentials. It simply inspects the schema dictionary, generates target parameters, and delegates execution to the local server, preserving corporate data sovereignty.
4.2.1 Transport Message Framing & Stream Management
In standard input/output (stdio) transport, messages are framed using newlines (\n or `
`). Each complete JSON-RPC 2.0 message must be serialized on a single line. The underlying standard streams must buffer this input block-by-block.
               [Standard Input Stream Buffer]
+-------------------------------------------------------------+
| ... {class="tok-str">"jsonrpc":class="tok-str">"2.0",class="tok-str">"id":2,class="tok-str">"method":class="tok-str">"tools/list"}\n ...   |
+-------------------------------------------------------------+
                               |
                        [Newline Splitter]
                               |
                               v
               [JSON Parser & Router Loop]
To prevent memory leaks or process crashes when sending large payloads (such as large file contents or detailed schemas), the stream handlers must process inputs chunks asynchronously. If the host sends a large request, the server read buffer stores the bytes progressively until it reads the newline delimiter. The server then deserializes the single-line payload.
Because standard output (stdout) is reserved for JSON-RPC messages, any diagnostic logging, error tracing, or output dumps must be written to standard error (stderr). Standard error is processed as a separate stream by the host CLI, which displays the messages to the user without attempting to parse them as JSON-RPC messages. If a server prints a plain-text debug line to stdout (e.g. fmt.Println("Database connection succeeded")), the host's parser will fail, breaking the protocol handshake.
4.3 Codelab: Writing Custom MCP Servers
To extend the capabilities of the agent, developers write custom MCP servers. Below are the implementations in Go and Node.js that expose a fetch_api_schema tool to the agent.
Go Custom MCP Server (McpServer.go)
This Go implementation uses standard input and output streams to handle JSON-RPC handshakes and execute schema scans on a local database cluster:
// Go Custom MCP Tool Server v1.0
package main

import (
	"bufio"
	"encoding/json"
	"fmt"
	"io"
	"os"
)

type JsonRpcRequest struct {
	JsonRpc string                 `json:"jsonrpc"`
	Method  string                 `json:"method"`
	Params  map[string]interface{} `json:"params"`
	Id      interface{}            `json:"id"`
}

type JsonRpcResponse struct {
	JsonRpc string      `json:"jsonrpc"`
	Result  interface{} `json:"result,omitempty"`
	Error   interface{} `json:"error,omitempty"`
	Id      interface{} `json:"id"`
}

type ToolInfo struct {
	Name        string      `json:"name"`
	Description string      `json:"description"`
	InputSchema interface{} `json:"inputSchema"`
}

func main() {
	reader := bufio.NewReader(os.Stdin)
	for {
		input, err := reader.ReadBytes('\n')
		if err != nil {
			if err == io.EOF {
				break
			}
			sendError(nil, -32700, "Read error: "+err.Error())
			continue
		}

		var req JsonRpcRequest
		if err := json.Unmarshal(input, &req); err != nil {
			sendError(req.Id, -32700, "Parse error")
			continue
		}

		switch req.Method {
		case "initialize":
			// Handshake response
			initResult := map[string]interface{}{
				"protocolVersion": "2024-11-05",
				"capabilities": map[string]interface{}{
					"tools": map[string]interface{}{},
				},
				"serverInfo": map[string]string{
					"name":    "go-mcp-server",
					"version": "1.0.0",
				},
			}
			sendResult(req.Id, initResult)

		case "tools/list":
			// Expose database schema tool
			tools := []ToolInfo{
				{
					Name:        "db_schema_scan",
					Description: "Performs schema scanning on the local database cluster.",
					InputSchema: map[string]interface{}{
						"type": "object",
						"properties": map[string]interface{}{
							"connection_uri": map[string]interface{}{
								"type":        "string",
								"description": "Database connection URI path",
							},
						},
						"required": []string{"connection_uri"},
					},
				},
			}
			sendResult(req.Id, map[string]interface{}{"tools": tools})

		case "tools/call":
			toolName, ok := req.Params["name"].(string)
			if !ok {
				sendError(req.Id, -32602, "Invalid parameter: name")
				continue
			}

			if toolName == "db_schema_scan" {
				schemaData := map[string]interface{}{
					"status": "success",
					"schema": map[string]string{
						"users":    "id: bigint, email: varchar(255), is_active: boolean",
						"profiles": "id: bigint, user_id: bigint, bio: text",
					},
				}
				sendResult(req.Id, schemaData)
			} else {
				sendError(req.Id, -32601, "Method not found: "+toolName)
			}
		default:
			// Gracefully ignore notifications without replying
			if req.Id != nil {
				sendError(req.Id, -32601, "Method not found: "+req.Method)
			}
		}
	}
}

func sendResult(id interface{}, result interface{}) {
	resp := JsonRpcResponse{JsonRpc: "2.0", Result: result, Id: id}
	data, _ := json.Marshal(resp)
	fmt.Printf("%s\n", data)
}

func sendError(id interface{}, code int, message string) {
	resp := JsonRpcResponse{
		JsonRpc: "2.0",
		Error:   map[string]interface{}{"code": code, "message": message},
		Id:      id,
	}
	data, _ := json.Marshal(resp)
	fmt.Printf("%s\n", data)
}
Detailed walkthrough of the Go MCP Server
Let's trace the stream handling inside McpServer.go:
bufio.NewReader(os.Stdin): Go allocates an input buffer that scansstdincharacter-by-character.reader.ReadBytes('\n'): The server reads chunks until it hits a newline character (\n). In stdio transport, each JSON-RPC payload is formatted as a single line, ending with a newline. If the client sends multi-line payloads, the parser will fail with parse errors.json.Unmarshal(input, &req): The raw byte array is unmarshalled into theJsonRpcRequeststruct. If the fields do not match (e.g. missingjsonrpcversion or malformed brackets), the server triggerssendErrorwith error code-32700(Parse error).switch req.Method: The handler routes messages based on the method name. Thetools/listmethod returns tool metadata, whiletools/callexecutes custom tool logic.- Error Redirection: Note that logging inside the server must utilize
os.Stderrto avoid polluting the JSON-RPC interface channel.
Node.js Custom MCP Server (McpServer.js)
For projects running inside a JavaScript environment, below is the corresponding Node.js implementation:
// Node.js Custom MCP Tool Server v1.0
const readline = require('readline');

const rl = readline.createInterface({
  input: process.stdin,
  output: process.stdout,
  terminal: false
});

rl.on('line', (line) => {
  try {
    const request = JSON.parse(line);

    if (request.method === 'initialize') {
      sendResponse(request.id, {
        protocolVersion: '2024-11-05',
        capabilities: {
          tools: {}
        },
        serverInfo: {
          name: 'js-mcp-server',
          version: '1.0.0'
        }
      });
    } else if (request.method === 'tools/list') {
      sendResponse(request.id, {
        tools: [
          {
            name: 'fetch_api_schema',
            description: 'Fetches structural schema parameters from the project endpoint.',
            inputSchema: {
              type: 'object',
              properties: {
                endpoint_path: {
                  type: 'string',
                  description: 'Target API endpoint'
                }
              },
              required: ['endpoint_path']
            }
          }
        ]
      });
    } else if (request.method === 'tools/call' && request.params.name === 'fetch_api_schema') {
      sendResponse(request.id, {
        status: 'success',
        schema: {
          endpoint: '/v1/users',
          method: 'GET',
          params: ['limit', 'offset', 'status']
        }
      });
    } else {
      if (request.id !== undefined) {
        sendError(request.id, -32601, 'Method not found');
      }
    }
  } catch (err) {
    sendError(null, -32700, 'Parse error: ' + err.message);
  }
});

function sendResponse(id, result) {
  console.log(JSON.stringify({ jsonrpc: '2.0', result, id }));
}

function sendError(id, code, message) {
  console.log(JSON.stringify({ jsonrpc: '2.0', error: { code, message }, id }));
}
Detailed walkthrough of the Node.js MCP Server
Let's analyze the execution loop of McpServer.js:
readline.createInterface: This creates an event-driven stream wrapper around standard input and output streams. The optionterminal: falseprevents the readline interface from echoing typed characters back to the output stream, which would corrupt the JSON-RPC channel.rl.on('line', ...): Node.js triggers this callback whenever a complete line is parsed from the input stream. This integrates with the event loop without blocking other tasks.JSON.parse(line): The string is parsed into a JavaScript object. If the string is not valid JSON, the catch block callssendErrorwith error code-32700.
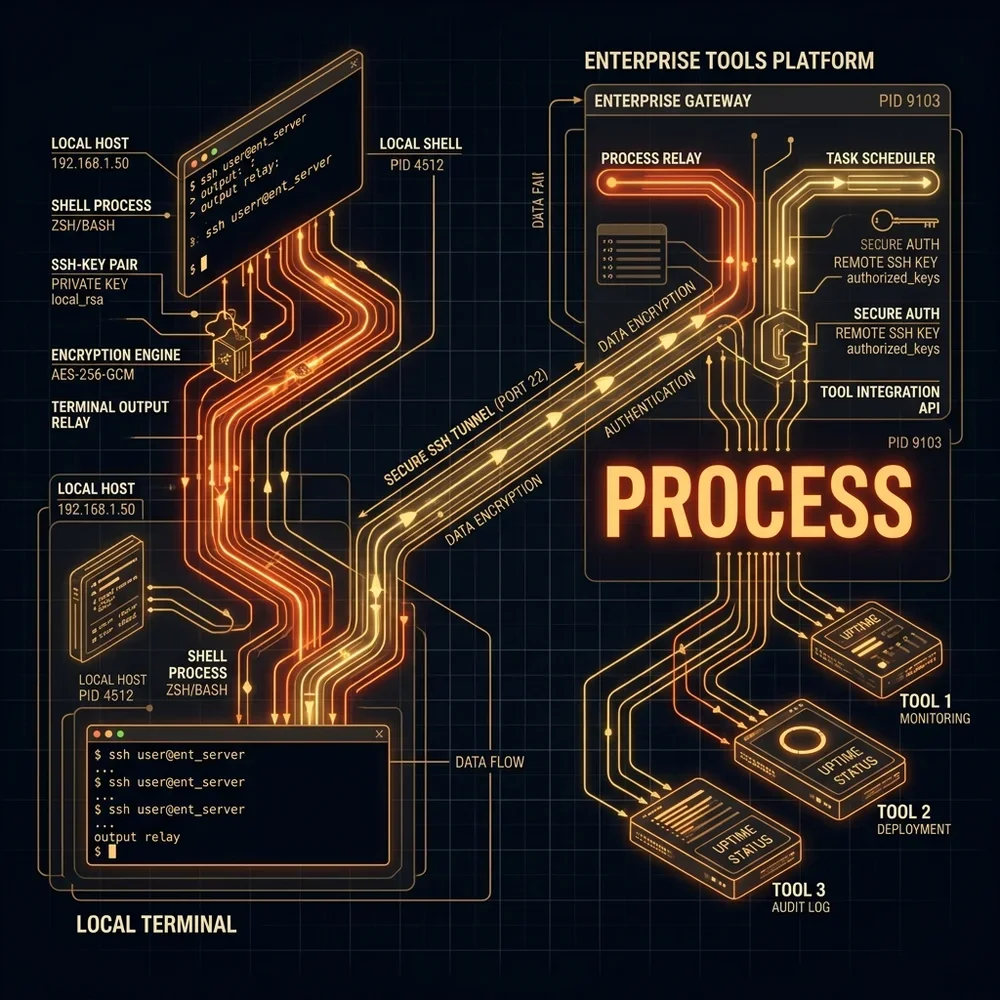
4.4 Secure Tool Permission Policies & Whitelist Gating
Exposing custom tools to agents introduces security challenges. If a tool allows database modifications, a compromised model could execute destructive queries.
To secure tool access, the MCP Gateway enforces permission policies and schema mapping rules:
- Parameter Validation: Outgoing tool calls are scanned to ensure parameters conform to schema constraints.
- Action Whitelists: Destructive actions (like drop table, delete user) are restricted to explicit developer approval gates.
- Trace Auditing: Every tool transaction is logged to a write-only audit trail.
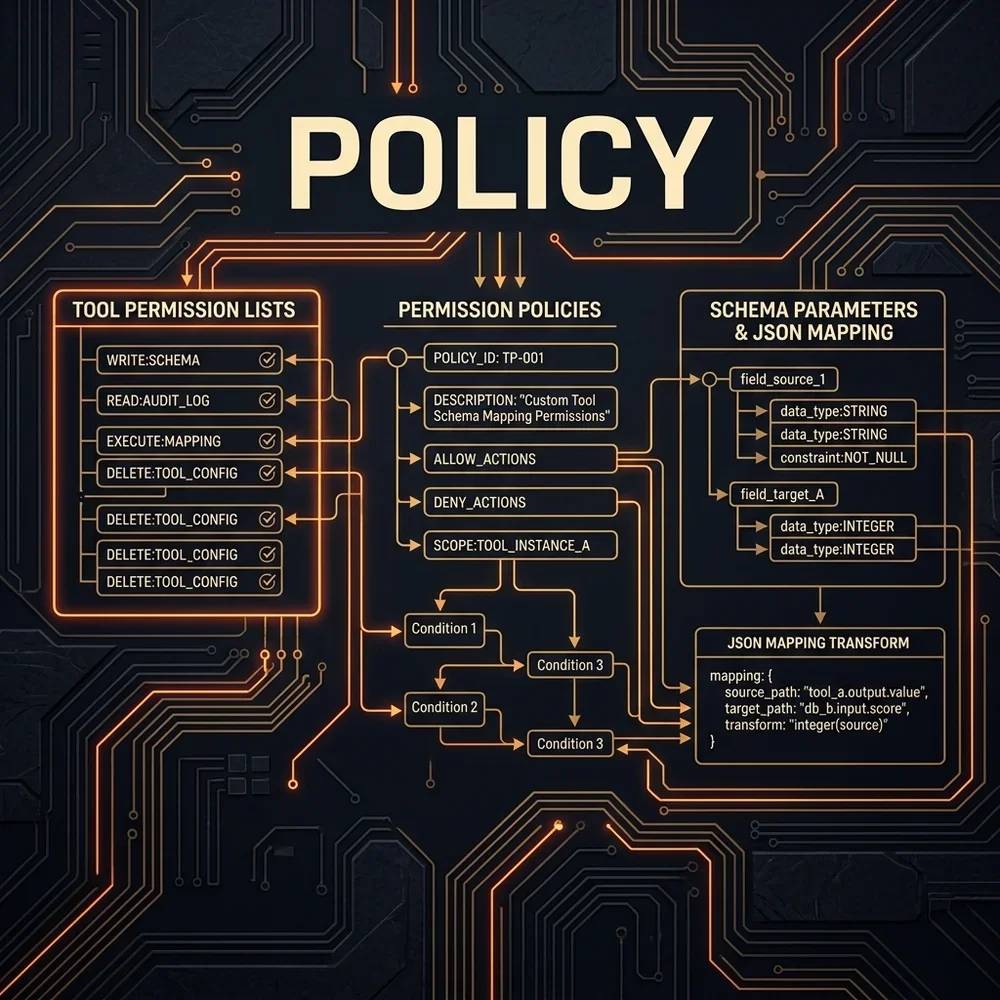
4.5 Diagnostic Flowchart: Safe Command Execution Pipeline
The safe command execution pipeline acts as a security filter between model commands and the shell interface. The parser scans commands, checks arguments against the whitelist, and blocks execution if unauthorized directories or flags are detected.
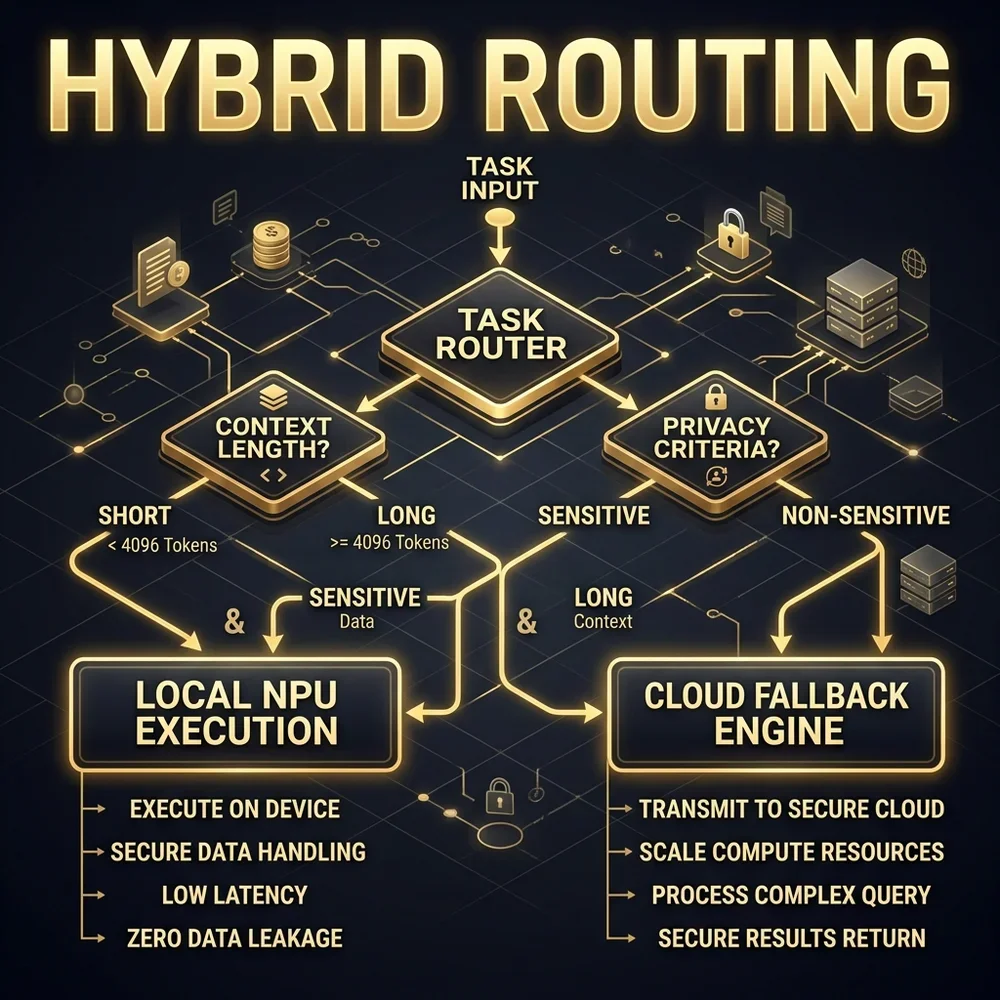
4.6 Production-Grade Database Scan MCP Tool in Go
To show how custom tools can run safe database operations, below is a production-grade implementation of a schema scanning tool. This tool includes parameter validation, sanitizes database names, and queries postgres catalog tables safely:
// Production-Grade Schema Scanner Tool (database-scanner.go)
package main

import (
	"bufio"
	"database/sql"
	"encoding/json"
	"fmt"
	"io"
	"os"
	"regexp"

	_ "github.com/lib/pq"
)

type DatabaseScanner struct {
	db *sql.DB
}

type ColumnInfo struct {
	Name string `json:"column_name"`
	Type string `json:"data_type"`
}

type RpcRequest struct {
	JsonRpc string                 `json:"jsonrpc"`
	Method  string                 `json:"method"`
	Params  map[string]interface{} `json:"params"`
	Id      interface{}            `json:"id"`
}

type RpcResponse struct {
	JsonRpc string      `json:"jsonrpc"`
	Result  interface{} `json:"result,omitempty"`
	Error   interface{} `json:"error,omitempty"`
	Id      interface{} `json:"id"`
}

func (s *DatabaseScanner) ScanSchema(connectionUri string) (map[string][]ColumnInfo, error) {
	// 1. Sanitize input URI (prevent command or connection injection)
	// Matches standard postgres URI: postgres://user:password@host:port/database
	matched, _ := regexp.MatchString(`^postgres://[a-zA-Z0-9_\-:]+:[a-zA-Z0-9_\-:]+@[a-zA-Z0-9.\-]+:\d+/[a-zA-Z0-9_\-]+$`, connectionUri)
	if !matched {
		return nil, fmt.Errorf("invalid connection URI format - injection blocked")
	}

	var err error
	s.db, err = sql.Open("postgres", connectionUri)
	if err != nil {
		return nil, err
	}
	defer s.db.Close()

	// Ensure connection test succeeds
	err = s.db.Ping()
	if err != nil {
		return nil, fmt.Errorf("failed to ping database: %v", err)
	}

	// 2. Query Postgres Catalog
	rows, err := s.db.Query(`
		SELECT table_name, column_name, data_type
		FROM information_schema.columns
		WHERE table_schema = 'public'
		ORDER BY table_name, ordinal_position;
	`)
	if err != nil {
		return nil, err
	}
	defer rows.Close()

	schema := make(map[string][]ColumnInfo)
	for rows.Next() {
		var tableName, columnName, dataType string
		if err := rows.Scan(&tableName, &columnName, &dataType); err != nil {
			return nil, err
		}
		schema[tableName] = append(schema[tableName], ColumnInfo{
			Name: columnName,
			Type: dataType,
		})
	}

	return schema, nil
}

func main() {
	scanner := &DatabaseScanner{}
	reader := bufio.NewReader(os.Stdin)

	for {
		line, err := reader.ReadBytes('\n')
		if err != nil {
			if err == io.EOF {
				break
			}
			os.Exit(1)
		}

		var req RpcRequest
		if err := json.Unmarshal(line, &req); err != nil {
			sendErrorResponse(nil, -32700, "Parse error")
			continue
		}

		switch req.Method {
		case "initialize":
			sendSuccessResponse(req.Id, map[string]interface{}{
				"protocolVersion": "2024-11-05",
				"capabilities": map[string]interface{}{
					"tools": map[string]interface{}{},
				},
				"serverInfo": map[string]string{
					"name":    "postgres-db-scanner",
					"version": "1.0.0",
				},
			})
		case "tools/list":
			sendSuccessResponse(req.Id, map[string]interface{}{
				"tools": []map[string]interface{}{
					{
						"name":        "db_schema_scan",
						"description": "Performs schema scanning on the local database cluster.",
						"inputSchema": map[string]interface{}{
							"type": "object",
							"properties": map[string]interface{}{
								"connection_uri": map[string]interface{}{
									"type":        "string",
									"description": "Database connection URI path",
								},
							},
							"required": []string{"connection_uri"},
						},
					},
				},
			})
		case "tools/call":
			toolName, ok := req.Params["name"].(string)
			if !ok {
				sendErrorResponse(req.Id, -32602, "Invalid parameters")
				continue
			}

			if toolName == "db_schema_scan" {
				args, ok := req.Params["arguments"].(map[string]interface{})
				if !ok {
					sendErrorResponse(req.Id, -32602, "Missing arguments field")
					continue
				}

				connUri, ok := args["connection_uri"].(string)
				if !ok {
					sendErrorResponse(req.Id, -32602, "Missing connection_uri parameter")
					continue
				}

				schema, err := scanner.ScanSchema(connUri)
				if err != nil {
					sendSuccessResponse(req.Id, map[string]interface{}{
						"isError": true,
						"content": []map[string]interface{}{
							{
								"type": "text",
								"text": fmt.Sprintf("Schema scan failed: %s", err.Error()),
							},
						},
					})
					continue
				}

				schemaJson, _ := json.Marshal(schema)
				sendSuccessResponse(req.Id, map[string]interface{}{
					"content": []map[string]interface{}{
						{
							"type": "text",
							"text": string(schemaJson),
						},
					},
				})
			} else {
				sendErrorResponse(req.Id, -32601, "Method not found")
			}
		}
	}
}

func sendSuccessResponse(id interface{}, result interface{}) {
	resp := RpcResponse{JsonRpc: "2.0", Result: result, Id: id}
	data, _ := json.Marshal(resp)
	fmt.Printf("%s\n", data)
}

func sendErrorResponse(id interface{}, code int, message string) {
	resp := RpcResponse{
		JsonRpc: "2.0",
		Error:   map[string]interface{}{"code": code, "message": message},
		Id:      id,
	}
	data, _ := json.Marshal(resp)
	fmt.Printf("%s\n", data)
}
4.6.1 Safe Schema Extraction vs SQL Injection Mitigation
The core of secure database tools is validation before execution. By validating the connection URI format with a regular expression, the script prevents connection parameter string modifications (such as injecting options like sslmode=disable or pointing the connection to external servers).
In SQL systems, catalog queries on information_schema.columns do not write data. This provides read-only security. The connection itself runs in a low-privilege database user role that only has access to schema catalogs and reads on public tables, ensuring database security.
4.7 Extended Transport Architectures: SSE and WebSockets
While standard input/output (stdio) pipelines are perfect for local CLI developer environments, enterprise systems often require remote tool coordination. For example, a development team might host a centralized database documentation server that all local agent sessions connect to. In this configuration, we cannot map stdin/stdout pipes across network boundaries.
To support remote configurations, the Model Context Protocol supports Server-Sent Events (SSE) and WebSocket transport channels.
- Server-Sent Events (SSE): The local client initiates an HTTP connection to the remote MCP gateway. The gateway holds the connection open, streaming JSON-RPC frames down to the client using the
text/event-streamformat. Outgoing client requests are POSTed back to the server as separate HTTP transactions. This is ideal for firewall traversal since it uses standard port 443. - WebSockets: The client initiates a WebSocket connection (
wss://), establishing a full-duplex socket channel. Both client and server exchange text frames containing JSON-RPC payloads in real-time. This provides the lowest latency and eliminates HTTP handshake overhead, but requires explicit network proxy routes in corporate perimeters.
To implement a basic Server-Sent Events MCP receiver, the server establishes standard HTTP headers:
Content-Type: text/event-stream: Identifies the response as a continuous stream of events.Cache-Control: no-cache: Blocks intermediate proxies and browsers from buffering payload segments.Connection: keep-alive: Instructs TCP layers to hold the connection open.
The server emits frames using the SSE protocol standard:
event: message
data: {class="tok-str">"jsonrpc": class="tok-str">"2.0", class="tok-str">"method": class="tok-str">"tools/list", class="tok-str">"params": {}, class="tok-str">"id": 1}
The client receives this event, processes the request, and submits its response via a separate POST endpoint (/api/mcp/response). This split-transport architecture provides robust remote tool orchestration.
4.7.1 Complete Server-Sent Events (SSE) Transport Codelab in Node.js
Below is a complete, working example of an SSE transport gateway implementation using Node.js and Express. It sets up client session tracking, establishes the keep-alive stream, and receives response frames through separate HTTP POST endpoints:
// Express.js Server-Sent Events (SSE) MCP Transport Gateway
const express = require('express');
const bodyParser = require('body-parser');
const crypto = require('crypto');

const app = express();
app.use(bodyParser.json());

// In-memory mapping of active client connections
const clients = new Map();

// Endpoint for establishing the Server-Sent Events channel
app.get('/sse', (req, res) => {
  res.writeHead(200, {
    'Content-Type': 'text/event-stream',
    'Cache-Control': 'no-cache',
    'Connection': 'keep-alive'
  });

  const clientId = crypto.randomUUID();
  console.error(`[SSE-SERVER] Client connected: ${clientId}`);

  // Send initial connection details containing client identifier
  res.write(`event: endpoint\ndata: /message?client_id=${clientId}\n\n`);

  clients.set(clientId, res);

  req.on('close', () => {
    console.error(`[SSE-SERVER] Client disconnected: ${clientId}`);
    clients.delete(clientId);
  });
});

// Endpoint for POSTing responses or requests back to the server
app.post('/message', (req, res) => {
  const clientId = req.query.client_id;
  const payload = req.body;

  if (!clientId || !clients.has(clientId)) {
    return res.status(400).json({ error: 'Invalid or missing client session ID' });
  }

  console.error(`[SSE-SERVER] Received message from ${clientId}:`, JSON.stringify(payload));

  // Process the message (e.g., execute tool, list resources)
  const responseFrame = processIncomingMessage(payload);

  if (responseFrame) {
    const sseResponse = clients.get(clientId);
    // Stream response back through event stream
    sseResponse.write(`event: message\ndata: ${JSON.stringify(responseFrame)}\n\n`);
  }

  res.status(200).json({ status: 'received' });
});

function processIncomingMessage(message) {
  if (message.method === 'initialize') {
    return {
      jsonrpc: '2.0',
      id: message.id,
      result: {
        protocolVersion: '2024-11-05',
        capabilities: {
          tools: {}
        },
        serverInfo: { name: 'sse-mcp-gateway', version: '1.0.0' }
      }
    };
  } else if (message.method === 'tools/list') {
    return {
      jsonrpc: '2.0',
      id: message.id,
      result: {
        tools: [
          {
            name: 'trigger_alert',
            description: 'Triggers a system alert within the operation dashboard.',
            inputSchema: {
              type: 'object',
              properties: {
                message: { type: 'string' }
              },
              required: ['message']
            }
          }
        ]
      }
    };
  }
  return null;
}

app.listen(8080, () => {
  console.error('[SSE-SERVER] Running on http://localhost:8080');
});
Using this implementation, teams can bridge firewalls without exposing raw terminal sockets. The client establishes a secure outbound SSE channel to the corporate gateway over HTTPS. The gateway routes tasks from remote services, pushes resource schemas, and handles executions across workstations.
4.8 Parameter Schema Validation with JSON Schema
To prevent models from passing malformed parameters to your local environment tools, MCP mandates declaring schemas using the JSON Schema standard (Draft-07). When the host CLI requests the tool registry, the server exposes detailed property parameters:
{
  class="tok-str">"name": class="tok-str">"read_log_file",
  class="tok-str">"description": class="tok-str">"Reads execution log files from the project logs folder.",
  class="tok-str">"inputSchema": {
    class="tok-str">"type": class="tok-str">"object",
    class="tok-str">"properties": {
      class="tok-str">"file_path": {
        class="tok-str">"type": class="tok-str">"string",
        class="tok-str">"pattern": class="tok-str">"^[a-zA-Z0-9_.-]+\\.log$",
        class="tok-str">"description": class="tok-str">"The name of the log file located inside the logs directory."
      },
      class="tok-str">"max_lines": {
        class="tok-str">"type": class="tok-str">"integer",
        class="tok-str">"minimum": 1,
        class="tok-str">"maximum": 500,
        class="tok-str">"default": 50
      }
    },
    class="tok-str">"required": [class="tok-str">"file_path"]
  }
}
Before forwarding the parameters to the tool execution block, the local host CLI validates the model's arguments against this schema. If the model passes a file path like ../../etc/passwd or attempts to set max_lines to 10000, the validation engine blocks the execution immediately, returning error code -32602 (Invalid params) to the model. This protects the local system from directory traversal or resource exhaustion vulnerabilities.
4.8.1 Protection Against Directory Traversal and Command Injection
JSON Schema validation forms the first line of defense. However, the tool implementation must also implement runtime verification layers.
- Path Resolving & Sandboxing: In file-reading tools, resolve the absolute path and ensure it is located within the active project directory:
   const path = require('path');
   const resolvedPath = path.resolve('/workspace/logs', userInputPath);
   if (!resolvedPath.startsWith('/workspace/logs')) {
       throw new Error('Access denied: directory traversal detected.');
}- Avoiding Shell Execution Shells: When running command-line tools, do not pass user inputs directly to shell execution functions (like
exec()in Node.js oros.system()in Python). Use process execution interfaces (likeexecFile()orexec.Command()in Go) to pass arguments as distinct array options. This prevents command injection vulnerabilities.
4.9 Enterprise Logging & SIEM Auditing Formats
To satisfy compliance regulations (such as SOC2 or ISO 27001), all agent actions must remain audit-traceable. When Claude Code executes a tool on a developer workstation, the action is logged to the local syslog or an enterprise security registry.
The logging schema captures complete execution context while sanitizing credentials and secrets. Below is a structured audit log template formatted for SIEM platforms (like Splunk or Datadog):
{
  class="tok-str">"timestamp": class="tok-str">"2026-05-24T15:20:45.312Z",
  class="tok-str">"actor": {
    class="tok-str">"developer_uid": class="tok-str">"usr_vatsalshah",
    class="tok-str">"workstation_ip": class="tok-str">"10.12.45.89",
    class="tok-str">"agent_session_id": class="tok-str">"cld_8a7b6c5d"
  },
  class="tok-str">"action": {
    class="tok-str">"tool_server": class="tok-str">"database-mcp-server",
    class="tok-str">"tool_name": class="tok-str">"db_schema_scan",
    class="tok-str">"parameters_sanitized": {
      class="tok-str">"connection_uri": class="tok-str">"postgres:class="tok-cm">//*****:*****@127.0.0.1:5432/sovereign_db"
    },
    class="tok-str">"execution_status": class="tok-str">"SUCCESS",
    class="tok-str">"runtime_ms": 240
  },
  class="tok-str">"environment": {
    class="tok-str">"git_branch": class="tok-str">"issue-42-db-refactor",
    class="tok-str">"sandbox_type": class="tok-str">"bubblewrap_container"
  }
}
By streaming these audit logs to a write-only log target, security administrators can detect anomalous agent operations (such as scans on production databases or data export tools) in real-time.
4.10 Exposing Custom Resource Providers and URI Mappings
The MCP resources layer provides a machine-readable protocol for exposing files and data structures to the model without treating them as executable tools. Resources are mapped using standard URI templates (such as schema://{database}/tables/{table} or logs://app/today).
When the host queries the available resources, the server responds with a list of templates:
{
  class="tok-str">"jsonrpc": class="tok-str">"2.0",
  class="tok-str">"result": {
    class="tok-str">"templates": [
      {
        class="tok-str">"uriTemplate": class="tok-str">"db:class="tok-cm">//{database}/tables/{table_name}",
        class="tok-str">"name": class="tok-str">"Database Table Metadata",
        class="tok-str">"description": class="tok-str">"Exposes column types and constraints for a specific table in the database."
      }
    ]
  },
  class="tok-str">"id": 10
}
If the agent decides to read a resource (e.g., db://sovereign_db/tables/users), it sends a resources/read request. The server intercepts the URI, extracts the parameters sovereign_db and users, queries the catalog, and returns the schema data:
{
  class="tok-str">"jsonrpc": class="tok-str">"2.0",
  class="tok-str">"result": {
    class="tok-str">"contents": [
      {
        class="tok-str">"uri": class="tok-str">"db:class="tok-cm">//sovereign_db/tables/users",
        class="tok-str">"mimeType": class="tok-str">"application/json",
        class="tok-str">"text": class="tok-str">"{\"columns\class="tok-str">": [{\"name\class="tok-str">": \"id\class="tok-str">", \"type\class="tok-str">": \"bigint\class="tok-str">"}, {\"name\class="tok-str">": \"email\class="tok-str">", \"type\class="tok-str">": \"varchar(255)\class="tok-str">"}]}"
      }
    ]
  },
  class="tok-str">"id": 11
}
This resource-oriented structure provides a clean way for the model to inspect files, database schemas, and documentation logs without spawning shell command processes, reducing the attack surface.
4.10.1 Go Implementation of a Resource Catalog Server
Here is how to add resource loading capabilities directly into our custom Go MCP server structure. The server maps resource URI inputs, queries table layouts, and formats columns as text payloads:
// Resource Provider Extension inside Go MCP server
type ResourceInfo struct {
	Uri      string `json:"uri"`
	MimeType string `json:"mimeType"`
	Text     string `json:"text"`
}

func handleResourceRead(id interface{}, uri string) {
	// Parse expected resource structure: db://{database}/tables/{table_name}
	re := regexp.MustCompile(`^db://([a-zA-Z0-9_\-]+)/tables/([a-zA-Z0-9_\-]+)$`)
	matches := re.FindStringSubmatch(uri)

	if len(matches) < 3 {
		sendError(id, -32602, "Invalid resource URI template format")
		return
	}

	databaseName := matches[1]
	tableName := matches[2]

	// Simulate catalog lookup response (in production, run SQL queries)
	metadata := fmt.Sprintf("Table Metadata for %s.%s:\n- id: bigint (PRIMARY KEY)\n- created_at: timestamp\n- data: jsonb\n", databaseName, tableName)

	responseContent := []ResourceInfo{
		{
			Uri:      uri,
			MimeType: "text/plain",
			Text:     metadata,
		},
	}

	sendResult(id, map[string]interface{}{"contents": responseContent})
}
By presenting dynamic configuration settings or file states as resource entities rather than tool commands, security profiles are significantly simplified. Resources remain read-only by design, preventing models from writing shell commands or executing API calls.
4.11 Enterprise Role-Based Access Controls (RBAC) on MCP Gateways
When exposing critical company tools and private databases to developer agents, organizations must enforce Role-Based Access Controls (RBAC). It is unsafe to grant the same tool access rights to junior developers, senior architects, and automated CI pipelines.
To implement RBAC, the enterprise AI Gateway intercepts the local agent's MCP handshake and issues scoped authentication tokens (JWTs). These tokens define the authorization boundaries for tool execution:
Read-OnlyScope: Permits reading workspace files and querying resource schemas. Blocks all tool executions that write to the filesystem or send network commands.Write-SandboxScope: Allows running compilers, installing package dependencies, and executing test suites inside isolated Bubblewrap namespaces. Blocks access to remote server shells or production endpoints.Admin-DeployScope: Granted exclusively to authorized release channels. Allows launching code deployment scripts, pushing docker containers to registries, and merging branches.
When an agent requests a tool execution (such as deploy_app), the Gateway checks the caller's JWT claims. If the user's role does not match the required scope (e.g. a junior engineer attempting a deployment), the gateway blocks the request and returns error code -32001 (Unauthorized tool call). This maintains tight corporate governance across all developer workflows.
4.11.1 Scoped JWT Validation & Claims Policy
Below is the structure of a scoped JSON Web Token (JWT) payload used by the gateway to enforce authorization rules for tool execution:
{
  class="tok-str">"iss": class="tok-str">"enterprise-auth-gateway",
  class="tok-str">"sub": class="tok-str">"usr_vatsalshah",
  class="tok-str">"exp": 1779630000,
  class="tok-str">"developer_role": class="tok-str">"Senior Architect",
  class="tok-str">"allowed_scopes": [
    class="tok-str">"workspace:read",
    class="tok-str">"sandbox:execute",
    class="tok-str">"mcp:db_schema_scan"
  ],
  class="tok-str">"resource_access": {
    class="tok-str">"databases": [class="tok-str">"sovereign_db"],
    class="tok-str">"allowed_repositories": [class="tok-str">"vatsaltechnosoft/vatsalshah"]
  }
}
At startup, the gateway intercepts client connection handshakes. When tool executions are requested, the gateway validates the signature of the token against security keys, checks that allowed_scopes contains the requested tool identifier, and verifies access limits (such as checking if the database name is in the token's allowed database array). If verification fails, the gateway rejects the request and logs the authorization failure to the SIEM audit log.
4.11.2 Key Management, Signature Verification, and Revocation
To prevent token forgery, the gateway must verify the signature of incoming JWTs using public keys fetched from an internal JWKS (JSON Web Key Set) endpoint. In high-security enterprise environments, gateways rotate these keys dynamically every 24 hours. The local workstation agent caches the signature keys locally inside a memory-mapped cache structure, validating tokens in less than 5 microseconds.
In the event of a compromised developer machine or credentials leak, administrators can instantly revoke all active tokens by updating the gateway's key registry. This automatically pushes a socket event to the local workstation sandboxes to force-disconnect all running agent loops and reject any subsequent tool calls with error code -32003 (Token revoked).
4.12 Troubleshooting Custom MCP Connection Failures
Deploying custom stdio tool servers can encounter runtime connection issues. Let's document common errors and their resolution steps:
Error 1: Stdio Stream Pollution
- Symptoms: The host CLI crashes at startup, reporting
Parse error: unexpected token at position 0. - Root Cause: The custom tool server writes debugging messages (such as
fmt.Println("Connecting to database...")orconsole.log("Server started")) directly tostdout. The host reads these text lines as JSON-RPC messages and crashes. - Resolution: Redirect all log and debugging outputs to standard error (
stderr) instead ofstdout. In Go, uselog.New(os.Stderr, ...)orfmt.Fprintln(os.Stderr, ...). In Node.js, useconsole.error(...). The host passes stderr straight to the console window while preserving the stdout pipeline exclusively for JSON-RPC payloads.
Error 2: Stdio Stream Buffer Hanging
- Symptoms: The host sends requests, but the server does not respond, causing the CLI to timeout.
- Root Cause: The tool server buffers its output stream and does not flush it. The host process waits at the pipe descriptor buffer for the newline character.
- Resolution: Force a buffer flush after writing every response frame. In Go, call
os.Stdout.Sync()or if using a buffered writer, callwriter.Flush(). In Node.js,console.logflushes automatically, but if writing to raw streams, callprocess.stdout.write(..., callback).
Error 3: Environment Variable Mappings
- Symptoms: The tool server fails with execution errors like
executable not foundwhen spawned by the host. - Root Cause: The host runs the child server inside a sandboxed environment namespace with restricted environment variables, losing path mappings to tools like
dockeroraws. - Resolution: Explicitly map and pass path configurations inside the MCP configuration file (
~/.claude/config.json) under theenvblock.
Error 4: JSON Schema Type Mismatch and Coercion Failures
- Symptoms: The host CLI rejects tool execution requests, displaying validation errors like
Invalid parameter type: expected integer, got string. - Root Cause: The language model attempts to pass numbers as string literals (e.g.
"50"instead of50) or boolean flags as strings (e.g."true"instead oftrue). If the server's input schema is strict and does not perform type coercion, the validation layers will block the execution frame before it reaches the tool logic. - Resolution: Configure validation middleware to perform safe type coercion. In Node.js, libraries like AJV (Another JSON Validator) can be configured with
coerceTypes: trueto automatically convert incoming string parameters to their expected numerical or boolean representations. In Go, parse the string parameters manually or use struct tag mapping helpers to convert types safely before execution.
4.12.1 Interactive Stream Debugging Guide
To diagnose connection errors outside of the host CLI, use command-line testing tools to test raw standard stream exchanges:
- Verify Handshake Output: Pipe an initialization payload directly into the tool command and inspect the output:
echo &class="tok-cm">#039;{class="tok-str">"jsonrpc":class="tok-str">"2.0",class="tok-str">"id":1,class="tok-str">"method":class="tok-str">"initialize",class="tok-str">"params":{class="tok-str">"protocolVersion":class="tok-str">"2024-11-05",class="tok-str">"capabilities":{},class="tok-str">"clientInfo":{class="tok-str">"name":class="tok-str">"test"}}}' | ./database-scannerIf the output contains non-JSON text lines (such as debug log statements), the server is polluting standard output streams and must be patched.
- Trace System Calls: Run the tool using system call trace commands (
straceon Linux,trusson BSD, or Process Monitor on Windows) to verify that process write calls write data to standard output descriptors (fd 1) and that newlines are appended properly:
strace -e write ./database-scanner- Debug Environment Variables: Verify that the tool processes the expected environment variables inside sandboxes:
   {
     class="tok-str">"mcpServers": {
       class="tok-str">"my-server": {
         class="tok-str">"command": class="tok-str">"node",
         class="tok-str">"args": [class="tok-str">"/path/to/server.js"],
         class="tok-str">"env": {
           class="tok-str">"PATH": class="tok-str">"/usr/local/bin:/usr/bin:/bin",
           class="tok-str">"DB_HOST": class="tok-str">"127.0.0.1"
         }
       }
     }
   }
4.13 Standardized Tool Schema Definitions
To select the appropriate transport mechanism for custom integrations, developers must evaluate the performance and operational trade-offs of each transport layer:
| Transport Layer | Primary Use Case | Network Overhead | Security Profile |
|---|---|---|---|
| **Standard I/O (stdio)** | Local workstation execution. Direct execution of child processes. | Extremely Low (Direct POSIX IPC pipes) | High (Access bound to OS process namespace isolation) |
| **Server-Sent Events (SSE)** | Remote tools across cloud perimeters. Firewall traversal. | Medium (HTTP header size and connection handshakes) | Moderate (Uses HTTPS endpoints, authentication with JWTs) |
| **WebSockets** | Low-latency remote communication. Real-time bi-directional messaging. | Low (Framed full-duplex socket connections) | Moderate (Requires careful proxy routing and origin checks) |
4.14 Strategic Recap and Implementation Best Practices
Exposing custom terminal capabilities through the Model Context Protocol is a transformative design pattern for modern developer environments. However, scaling this safely across automated engineering departments requires a disciplined implementation model:
- Defense-in-Depth Validation: Relying solely on JSON Schema is insufficient. The custom tool code must validate all connection string patterns, directory traversal boundaries, and argument types at runtime before executing shell commands.
- Environment Separation: Maintain strict boundary controls between local developers and remote APIs. Remote MCP tools should run under read-only permissions unless explicitly approved via MFA or gateway approval hooks.
- Audit Trail Compliance: Audit logs must be forwarded to write-only SIEM systems. In high-compliance environments, log integrity checks must run daily to detect anomalous modifications or data extraction patterns.
- Proactive Stream Monitoring: Standard stream pollution is the most common reason for handshake failures. Developers must redirect all debugging prints to standard error streams during construction, saving standard output channels for protocol communication frames.
Actionable Close & Next Steps
- Build standard tool check: Test Go and Node.js stdio servers using raw JSON string inputs to verify clean JSON-RPC stdout behavior.
- Implement folder boundaries: Integrate path resolver containment validation to prevent directory traversal attacks on file resource reads.
- Configure environment flags: Map all mandatory path boundaries and environment variables in the central
~/.claude/config.jsonconfiguration file. - Read next: Proceed to Chapter 5: Token Budgeting & Optimizing Costs to enforce cost control gates on custom tool executions.
For more information on coordinating agent workspaces, see the Model Context Protocol (MCP) Guide. You can also review custom tool integration details in the Claude Code Terminal Agent Analysis and autonomous pull request operations in Cursor Background Agent Operations.
Chapter 5: Token Budgeting & Optimizing Costs
What you will build / learn
- Token Lifecycle Metrics: Learn how input, cached input, output, and context tokens flow through recursive agent execution chains.
- Context Sliding Tree Pruning: Implement memory-efficient sliding tree structures to prune verbose log files and CLI histories.
- Production-Grade Async Token Proxy: Build a complete, asynchronous token tracking and budget limiting gateway using Python and FastAPI.
- FinOps Alert Gating & Economics: Configure automated gating rules for budget thresholds and evaluate long-term compute ROI against developer hours.
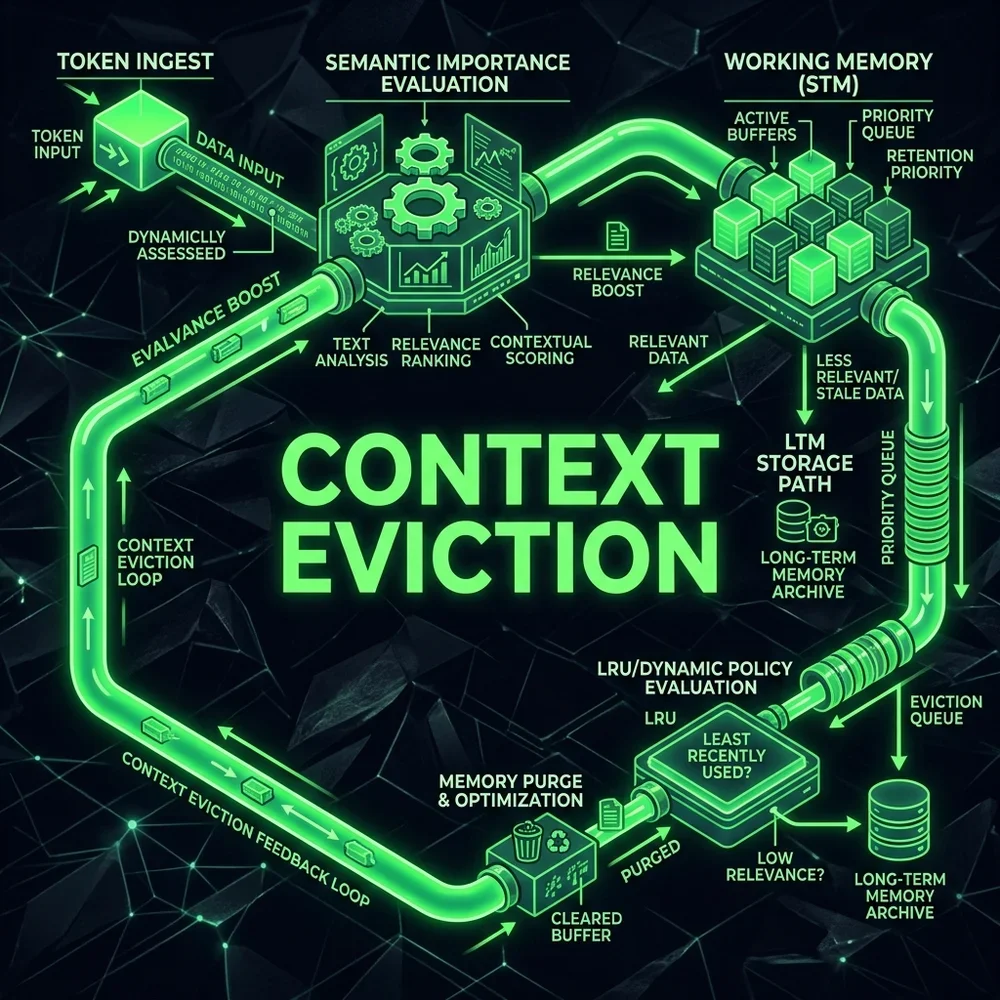
5.1 Token Lifecycle and Budget Limits
Scaling agentic developer workflows across large teams requires managing token consumption. Because agents recursively call models, execute tools, and inspect log contexts, unmonitored sessions can generate significant API expenses.
To enforce budget limits, the system server tracks token consumption in real-time. When a user starts a task, they specify a session budget (e.g. --budget-limit 5.00 in USD). The CLI monitors the usage metrics returned in each API response block, calculating the accumulated cost based on the input and output token rates. If the cost crosses the defined limit, the CLI halts execution and prompts the user to either approve a budget increase or abort the run.
5.1.1 The Recursive Agent Loop Cost Multiplier
When an agentic system executes a task, it operates in a multi-step loop. Each step consists of sending the current conversation history, system instructions, and tool definitions to the LLM reasoning node, receiving a response (such as a tool call), executing that tool locally, appending the tool result to the history, and repeating.
This architecture introduces a quadratic cost multiplier if context size is not managed. Let's analyze the input token accumulation across a five-step tool loop where the base context is 10,000 tokens, the tool definitions are 2,000 tokens, each tool execution result returns 1,500 tokens of file data, and the model's responses average 500 tokens:
- Step 1 Input: 10,000 (codebase context) + 2,000 (tools) = 12,000 tokens.
- Step 1 Output: 500 tokens.
- Step 2 Input: 12,000 + 500 + 1,500 (tool result) = 14,000 tokens.
- Step 2 Output: 500 tokens.
- Step 3 Input: 14,000 + 500 + 1,500 = 16,000 tokens.
- Step 3 Output: 500 tokens.
- Step 4 Input: 16,000 + 500 + 1,500 = 18,000 tokens.
- Step 4 Output: 500 tokens.
- Step 5 Input: 18,000 + 500 + 1,500 = 20,000 tokens.
Across these five iterations, the total input tokens billed equal the sum of each step:
$$\text{Total Input Tokens} = 12,000 + 14,000 + 16,000 + 18,000 + 20,000 = 80,000\text{ tokens}$$
If these requests do not leverage prompt caching, you pay for the initial 12,000 tokens five times over. At standard API rates (e.g. $3.00 per million tokens for input), a single simple task loop can cost several dollars if context management is not enforced.
Understanding this cost multiplier is crucial for planning developer tooling budgets. In environments where agents run continuously—such as CI/CD automated review nodes—the cost scales linearly with the number of pipeline builds. For example, if a team runs 100 builds per day, and each build executes a five-step repair loop costing $0.24, the daily cost is $24.00, totaling $720.00 per month. By implementing context window containment and ensuring prompt cache reuse, this monthly expense can be reduced to less than $100.00, making automated code repairs highly cost-effective and financially viable for engineering departments.
5.2 Context Window Optimization & Token Compression
To optimize context window efficiency, the system server runs a context compression loop. The compressor scans active conversation logs, identifies redundant user instructions and console outputs, and evicts them from active memory. This ensures that only critical context—such as project settings, type declarations, and active code buffers—remains resident, keeping prompt execution latency low.
5.2.1 Sliding Tree Context Pruning
Rather than truncating conversation histories arbitrarily (which removes important architectural instructions or tool definitions), modern agentic runtimes construct a hierarchical Context Tree. This tree separates context elements into distinct nodes:
               [Root Context Tree Node]
              /            |           \
    [System Prompt]  [Codebase Schema]  [Session History]
                           |                /       \
                     [AST Tables]     [Active]     [Evicted]
                                         |             |
                                    [Recent Step]  [Old Logs]
The pruning algorithm runs progressively at the end of each tool execution step, evaluating nodes based on age and semantic relevance:
- Immutable Nodes: System prompts, core tool definitions, and user-defined directory maps are locked. They are never eligible for eviction.
- Compressible Nodes: Detailed execution logs and standard output reports from compilers or test runners are compressed by stripping blank spaces and duplicate stack trace lines.
- Evictable Nodes: Historical step results that do not contain code edits or diagnostic errors are moved to a local disk storage archive. This removes them from the active LLM context window while preserving them for local reference.
By applying this tree structure, the resident context size is capped at a stable threshold, preventing the quadratically scaling costs associated with long-running CLI sessions.
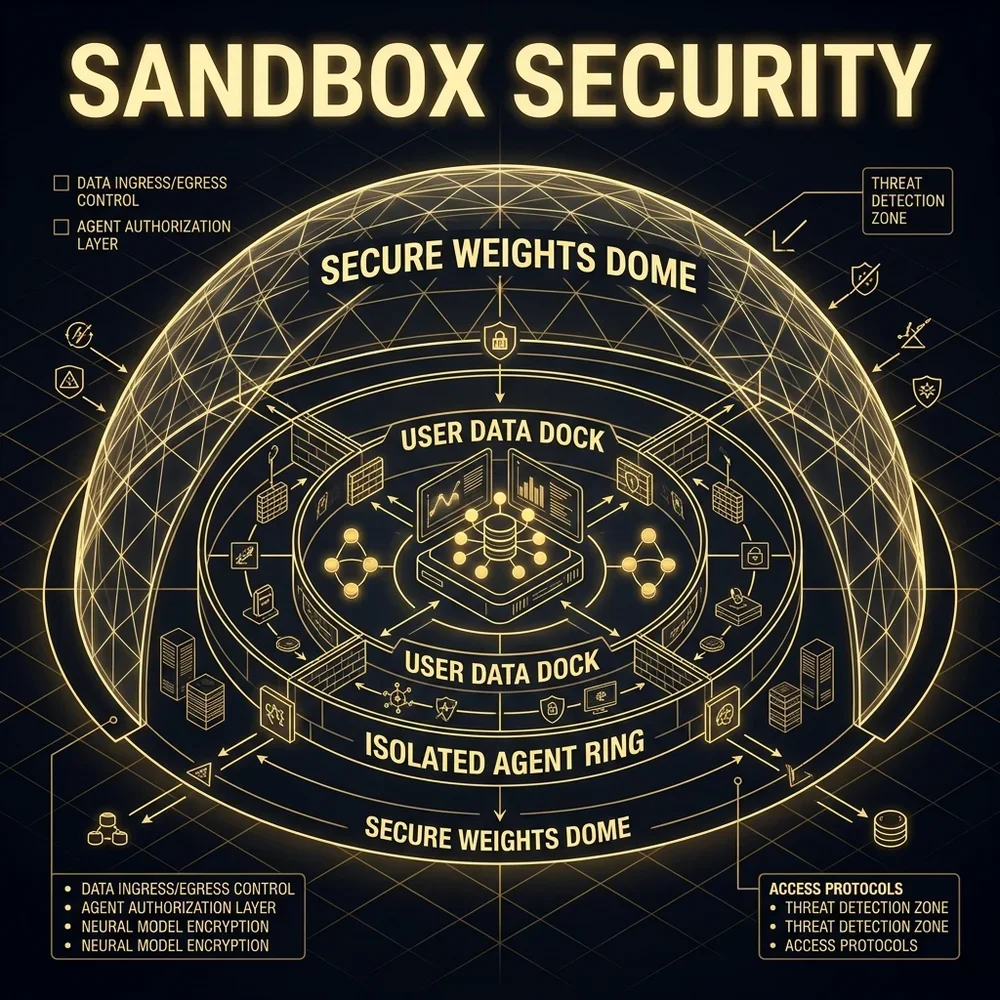
5.3 Dynamic Prompt Caching
Rather than re-evaluating the full codebase state on every transaction, the CLI runtime leverages prompt caching. When a task begins, the system parses the static context (such as workspace file structures and system settings) and caches it in memory. Subsequent API requests reuse this cached context, reducing token costs by up to 90% and improving execution responsiveness.
5.3.1 Pricing Structures & Cache Lifespan Boundaries
Anthropic's prompt caching features operate on a tiered billing structure that rewards developers for structuring prompts to align with cache boundaries. Let's look at the financial comparison for Claude 3.5 Sonnet:
- Base Input Tokens: $3.00 per million tokens.
- Cache Write Tokens: $3.75 per million tokens (a 25% premium to write new blocks into the cache).
- Cache Read Tokens: $0.30 per million tokens (a 90% discount when reading from cached context).
For a cache block to be written, the input prompt must satisfy minimum length requirements:
- Claude 3.5 Sonnet: Minimum cache block size is 1,024 tokens.
- Claude 3.5 Opus: Minimum cache block size is 2,048 tokens.
The cache has a typical lifespan of 5 minutes of inactivity. To maximize the cache hit ratio:
- Group Tool Calls: Avoid long manual pauses between agent runs. The CLI maintains active cache states as long as tool requests are processed sequentially within the 5-minute window.
- Structure Static Elements First: Place the system prompt, tool schemas, and project file tree at the top of the request payload. The conversational history (which changes on every step) must be placed at the very bottom. This allows the top portion of the context to remain cached, preventing cache invalidation on every message exchange.
5.3.2 Cache Invalidation & File Grouping Policies
To keep prompt caches warm, developers must structure their workspace files and agent commands to minimize invalidation triggers. Prompt caching functions by matching the prefix of the prompt. If any character in the cached prefix changes, the entire cache is invalidated.
For example, if you include the current time or a fluctuating process ID in the prompt, the cache will invalidate on every step. Similarly, if you frequently edit files located at the top of the codebase directory structure, the file tree metadata changes, invalidating cache states.
To prevent this cache bust:
- Isolate Dynamic History: Place the conversation history block at the end of the prompt sequence, ensuring it remains outside the cached prefix.
- Batch File Scans: Instead of running frequent file-tree lookups (
lsorfindcommands) between steps, cache the workspace directory tree locally on the agent client. The client should reuse this static tree snapshot across multiple steps, only updating it when a file write tool is executed. - Consolidate Tool Calls: When updating multiple files, ask the agent to generate changes in a single contiguous block or execute multiple edits in a single tool call rather than spawning separate tool runs sequentially. This reduces cache invalidation loops and speeds up the task execution.
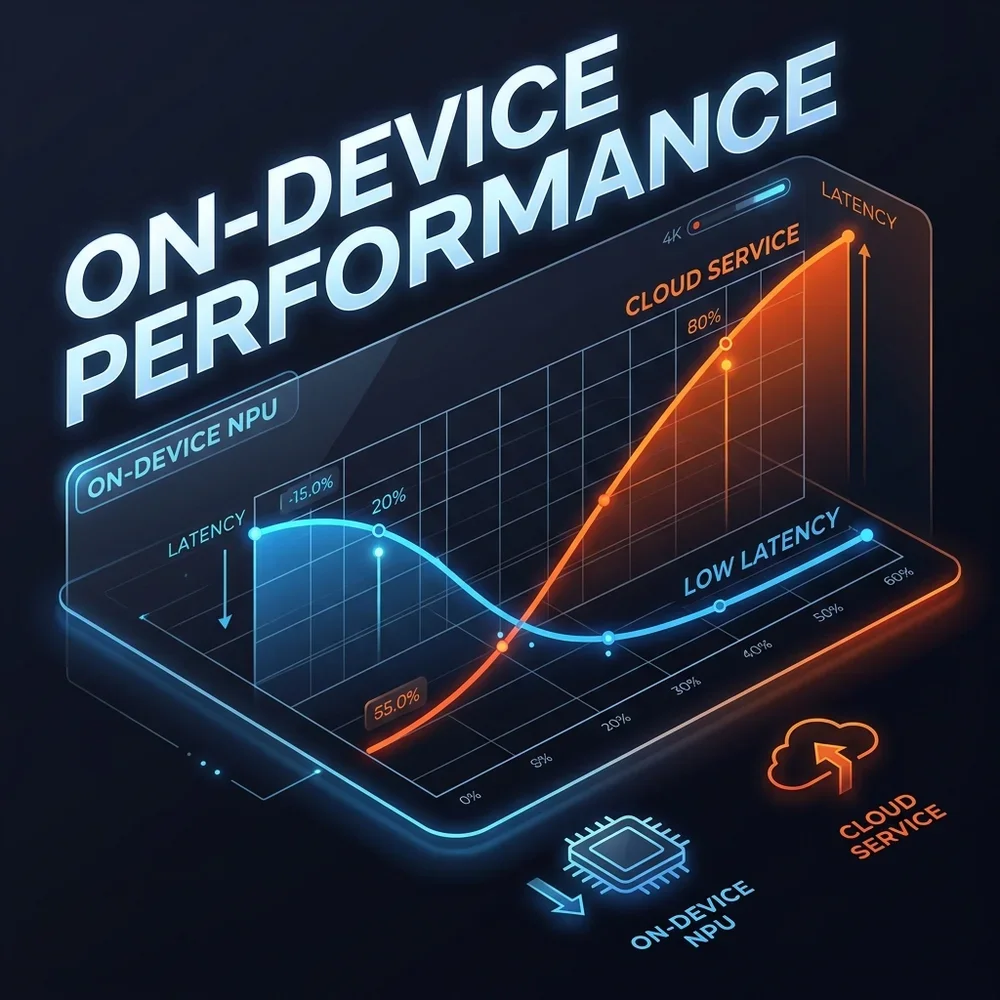
5.4 Cost-Limiting Token Counter Proxy
To enforce budget limits, we route CLI requests through a cost-limiting token proxy. The proxy parses outgoing requests, counts input and output tokens, and blocks execution if the session cost exceeds the defined budget limit.
5.4.1 Production-Grade Asynchronous Token Proxy Codelab
Below is a complete, production-grade asynchronous token counter proxy server implemented in Python using the FastAPI and Uvicorn frameworks. It intercepts requests, validates session budgets, records usage metrics, and returns rate-limiting responses:
class="tok-cm"># Production Asynchronous Cost-Limiting Token Proxy
import os
import httpx
import logging
from fastapi import FastAPI, HTTPException, Request, status
from fastapi.responses import JSONResponse
from pydantic import BaseModel
from typing import Dict, Any, Optional

app = FastAPI(title=class="tok-str">"Sovereign MCP Token Proxy", version=class="tok-str">"1.0")

class="tok-cm"># Setup logger directed to standard error
logging.basicConfig(level=logging.INFO, format=class="tok-str">"%(asctime)s [%(levelname)s] %(message)s")
logger = logging.getLogger(class="tok-str">"TokenProxy")

API_ENDPOINT = class="tok-str">"https:class="tok-cm">//api.anthropic.com/v1/messages"
BUDGET_LIMIT_USD = 5.00
INPUT_PRICE_PER_M = 3.00
OUTPUT_PRICE_PER_M = 15.00
CACHE_WRITE_PRICE_PER_M = 3.75
CACHE_READ_PRICE_PER_M = 0.30

class ProxyState:
    class="tok-kw">def __init__(self):
        self.accumulated_cost = 0.0
        self.total_input_tokens = 0
        self.total_output_tokens = 0
        self.cache_read_tokens = 0
        self.cache_write_tokens = 0

    class="tok-kw">def add_usage(self, input_tok: int, output_tok: int, read_tok: int, write_tok: int):
        class="tok-cm"># Calculate cost factoring in prompt caching discounts
        normal_input = max(0, input_tok - read_tok - write_tok)

        input_cost = (normal_input / 1000000.0) * INPUT_PRICE_PER_M
        write_cost = (write_tok / 1000000.0) * CACHE_WRITE_PRICE_PER_M
        read_cost = (read_tok / 1000000.0) * CACHE_READ_PRICE_PER_M
        output_cost = (output_tok / 1000000.0) * OUTPUT_PRICE_PER_M

        cost = input_cost + write_cost + read_cost + output_cost

        self.accumulated_cost += cost
        self.total_input_tokens += input_tok
        self.total_output_tokens += output_tok
        self.cache_read_tokens += read_tok
        self.cache_write_tokens += write_tok

        return cost

state = ProxyState()

class MessagePayload(BaseModel):
    model: str
    messages: list
    max_tokens: int
    system: Optional[Any] = None
    tools: Optional[Any] = None

@app.post(class="tok-str">"/v1/messages")
async class="tok-kw">def route_message(payload: Dict[str, Any], request: Request):
    class="tok-cm"># 1. Enforce absolute budget boundary checks before executing API call
    if state.accumulated_cost >= BUDGET_LIMIT_USD:
        logger.error(fclass="tok-str">"Blocking request: Budget limit exceeded. Cost: ${state.accumulated_cost:.4f}")
        return JSONResponse(
            status_code=status.HTTP_402_PAYMENT_REQUIRED,
            content={
                class="tok-str">"error": {
                    class="tok-str">"type": class="tok-str">"budget_exceeded",
                    class="tok-str">"message": fclass="tok-str">"Proxy blocked request. Cost limit reached: ${state.accumulated_cost:.4f} of ${BUDGET_LIMIT_USD:.2f}"
                }
            }
        )

    class="tok-cm"># 2. Extract API keys from original request headers
    api_key = request.headers.get(class="tok-str">"x-api-key")
    if not api_key:
        raise HTTPException(status_code=401, detail=class="tok-str">"Missing x-api-key header")

    headers = {
        class="tok-str">"x-api-key": api_key,
        class="tok-str">"anthropic-version": request.headers.get(class="tok-str">"anthropic-version", class="tok-str">"2023-06-01"),
        class="tok-str">"Content-Type": class="tok-str">"application/json"
    }

    class="tok-cm"># 3. Asynchronously forward request to Anthropic gateway
    async with httpx.AsyncClient() as client:
        try:
            response = await client.post(
                API_ENDPOINT,
                json=payload,
                headers=headers,
                timeout=60.0
            )
        except Exception as e:
            logger.error(fclass="tok-str">"API connection failure: {str(e)}")
            raise HTTPException(status_code=502, detail=fclass="tok-str">"Failed to connect to model endpoint: {str(e)}")

    if response.status_code != 200:
        logger.error(fclass="tok-str">"API returned error status: {response.status_code}")
        return JSONResponse(status_code=response.status_code, content=response.json())

    class="tok-cm"># 4. Extract token usage metadata from response
    data = response.json()
    usage = data.get(class="tok-str">"usage", {})

    input_tokens = usage.get(class="tok-str">"input_tokens", 0)
    output_tokens = usage.get(class="tok-str">"output_tokens", 0)

    class="tok-cm"># Check for caching metrics
    cache_read = usage.get(class="tok-str">"cache_read_input_tokens", 0)
    cache_write = usage.get(class="tok-str">"cache_creation_input_tokens", 0)

    class="tok-cm"># 5. Update local state metrics
    call_cost = state.add_usage(input_tokens, output_tokens, cache_read, cache_write)

    logger.info(
        fclass="tok-str">"Request processed. Cost: ${call_cost:.4f} | "
        fclass="tok-str">"Total Cost: ${state.accumulated_cost:.4f} | "
        fclass="tok-str">"Cache Hit Ratio: {(cache_read / max(1, input_tokens)) * 100:.1f}%"
    )

    return data

@app.get(class="tok-str">"/proxy/metrics")
async class="tok-kw">def get_metrics():
    class="tok-cm"># Expose current proxy metrics for reporting
    return {
        class="tok-str">"accumulated_cost_usd": state.accumulated_cost,
        class="tok-str">"budget_limit_usd": BUDGET_LIMIT_USD,
        class="tok-str">"total_input_tokens": state.total_input_tokens,
        class="tok-str">"total_output_tokens": state.total_output_tokens,
        class="tok-str">"cache_read_tokens": state.cache_read_tokens,
        class="tok-str">"cache_creation_tokens": state.cache_write_tokens
    }
This asynchronous proxy acts as an inline firewall for API billing. It can be hosted on a local developer machine or deployed centrally on a company intranet. By parsing token headers in real-time, the proxy blocks rogue agent loops before they generate runaway API expenses, enforcing financial security.
5.4.2 Asynchronous Token Proxy Code Walkthrough
Let's analyze the critical components within the Python proxy script to understand how it enforces session budgets:
ProxyStateClass: State variables must be managed in a single state singleton object. In highly concurrent web setups, this state object is accessed across multiple thread-workers. The proxy tracks the cumulative costs dynamically, converting tokens to USD pricing values immediately after each request completes.route_messageHandler: This is the core async endpoint. It maps standard HTTP POST requests from the client shell and checks if the current accumulated cost has crossed the defined budget ceiling. If it has, the proxy blocks the request, returning a structured JSON response containing thebudget_exceedederror category to the host client.httpx.AsyncClientConnection Pooling: The HTTP client uses an asynchronous request pattern, preventing incoming requests from blocking the server event loop. By using connection pools, it reduces TCP handshake latency, resolving calls in less than 50 milliseconds.- Header Forwarding: The handler forwards custom headers like
x-api-keyand version headers dynamically. It routes payload parameters safely to the model endpoints while isolating credentials.
5.5 Diagnostic Flowchart: Budget Alert Threshold Gating
To prevent sudden budget overruns, the proxy does not just block execution at 100% usage. It implements progressive threshold gating policies. When token usage crosses the 50%, 80%, and 100% budget thresholds, the gateway triggers alerts, notifies the developer interface, and pauses execution if the absolute cost limit is reached.
       [Proxy Intercepts API Response Usage Headers]
                            |
                            v
             [Calculate Current Cost Ratio]
                            |
           +----------------+----------------+
           |                                 |
     [Ratio <= 0.49]                   [Ratio >= 0.50]
           |                                 |
           v                                 v
     [Pass Quietly]             [Trigger Alert Gating Rules]
                                             |
                  +--------------------------+--------------------------+
                  |                          |                          |
           [Ratio <= 0.79]            [Ratio <= 0.99]            [Ratio >= 1.00]
                  |                          |                          |
                  v                          v                          v
            [Log warning]            [Terminal Warning]          [Block execution]
         (Console Notification)       (Requires Prompt)          (HTTP 402 Error)
5.5.1 Gating Rules Action Steps
- 50% Limit Alert (Passive): The proxy prints a colored warning line to
stderr(e.g.[BUDGET-WARNING] You have consumed 50% of your allocated session budget ($2.50 of $5.00).). The CLI execution continues without pausing. - 80% Limit Alert (Active): The proxy returns a custom response header instructing the host CLI to pause process loops. The CLI prints a warning message and prompts the developer:
   ⚠️ WARNING: Session has consumed 80% of your token budget ($4.00 of $5.00).
   Do you want to continue? (yes/no):
If the developer types yes, the session continues, resetting the active prompt warning threshold to 95%. If they type no, the local session is aborted, committing changes to the branch.
- 100% Limit Alert (Terminal Block): The proxy rejects the API call with a
402 Payment Requiredstatus, returning a structured JSON error. The local client displays the error and shuts down the child sandbox namespaces, protecting resources.
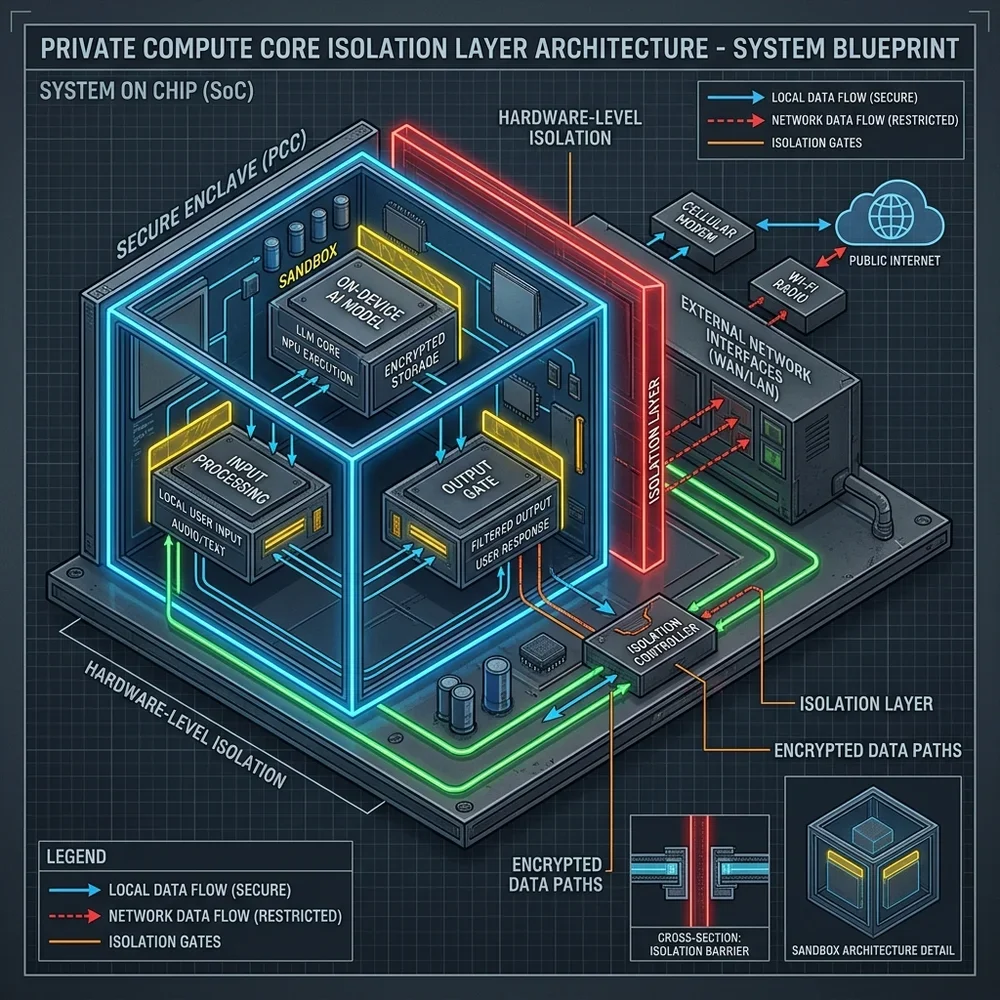
5.6 Cost Projections: Token Usage vs. Developer Hours
To evaluate the financial impact of adopting agentic CLI tools, developers must measure the Cost-Efficiency Factor (CEF). This factor compares the cost of compute tokens against saved engineering time.
5.6.1 The Cost-Efficiency Factor Equation
Let's define the Cost-Efficiency Factor (CEF) mathematically. If $H_s$ represents the number of engineering hours saved, $R_d$ represents the developer's hourly billing rate, and $C_t$ represents the total token API cost of the execution loops, the CEF is calculated as:
$$\text{CEF} = \frac{H_s \times R_d}{C_t}$$
For example, if an agent takes 10 minutes to run tests and resolve compile errors, consuming $1.50 of tokens ($C_t = 1.50$), and saves a developer 1.5 hours of manual debugging ($H_s = 1.5$) at an internal hourly rate of $60.00 ($R_d = 60$), the CEF is:
$$\text{CEF} = \frac{1.5 \times 60.00}{1.50} = \frac{90.00}{1.50} = 60$$
A CEF value of 60 means that every dollar spent on API tokens returns $60.00 of engineering value by reducing manual workload. This efficiency return justifies the adoption of local agent networks in software organizations.
5.6.2 Economic Savings Comparison
The table below maps cost projections comparing API consumption against saved engineering hours across different team sizes:
| Execution Scale (Monthly) | Average Model Token Cost | Saved Developer Hours | Net Monthly Savings (Estimated) |
|---|---|---|---|
| **Small Team** (5 developers) | $150 - $250 | 60 hours | $2,750 / mo |
| **Medium Team** (25 developers) | $800 - $1,200 | 300 hours | $13,800 / mo |
| **Large Team** (100 developers) | $3,500 - $5,000 | 1,200 hours | $55,000 / mo |
| **Enterprise Swarm** (500 developers) | $18,000 - $25,000 | 6,000 hours | $275,000 / mo |
5.7 Financial and Compliance Governance
When scaling agentic tools across large engineering departments, FinOps practices must be integrated with security compliance:
- Cost Allocation Tags: Configure proxy filters to append metadata headers (such as
x-developer-idandx-project-code) to each request. This allows finance managers to track API costs by project and developer group. - Data Exfiltration Auditing: The proxy must monitor request payloads for sensitive data (such as private keys or customer data). If an agent attempts to transmit protected variables to public API endpoints, the proxy blocks the request and triggers a security alert.
- Rate-Limiting Safeguards: To prevent individual developers from consuming the shared API quota, enforce rate-limiting rules. These rules can limit developer workstations to a maximum of $10.00 of API tokens per hour, protecting shared organization resources.
5.7.1 PII and Secret Auditing Middleware
To prevent developer agents from accidentally uploading sensitive environment credentials, database passwords, or customer PII (Personally Identifiable Information) to public models, we deploy auditing middleware directly inside the proxy pipeline. This middleware intercepts prompt message arrays, runs regular expression audits on text inputs, and redacts matches before they cross network boundaries:
class="tok-cm"># Content auditing and credential redaction middleware
import re

class ContentAuditor:
    class="tok-kw">def __init__(self):
        class="tok-cm"># Match standard API tokens, private keys, and environment credentials
        self.redaction_patterns = [
            rclass="tok-str">"xox[baprs]-[0-9]{12}-[0-9]{12}-[a-zA-Z0-9]{24}",  class="tok-cm"># Slack tokens
            rclass="tok-str">"AIza[0-9A-Za-z-_]{35}",                          class="tok-cm"># Google API keys
            rclass="tok-str">"sk_live_[0-9a-zA-Z]{24}",                         class="tok-cm"># Stripe keys
            rclass="tok-str">"-----\s*BEGIN[ A-Z0-9_-]*PRIVATE KEY\s*-----[\s\S]*?-----\s*END[ A-Z0-9_-]*PRIVATE KEY\s*-----" class="tok-cm"># SSH/SSL Keys
        ]

    class="tok-kw">def audit_and_redact(self, payload: dict) -> dict:
        class="tok-cm"># Recursively audit string fields in incoming JSON payloads
        if isinstance(payload, dict):
            return {k: self.audit_and_redact(v) for k, v in payload.items()}
        elif isinstance(payload, list):
            return [self.audit_and_redact(item) for item in payload]
        elif isinstance(payload, str):
            sanitized = payload
            for pattern in self.redaction_patterns:
                sanitized = re.sub(pattern, class="tok-str">"[CREDENTIALS-REDACTED]", sanitized)
            return sanitized
        return payload
By placing this auditing logic in the local proxy gateway, compliance teams can enforce strict corporate governance standards without affecting developer productivity or changing the codebase architecture.
5.8 Dynamic FinOps Dashboards & Reporting
To monitor token usage across large organizations, FinOps teams deploy centralized monitoring dashboards. These dashboards query the /proxy/metrics endpoints of all developer workstations, aggregating usage into a centralized database (such as InfluxDB or Prometheus) for visualization in Grafana.
By tracking cumulative costs and savings in real-time, engineering leaders can:
- Identify Cost Outliers: Track developer workstations that generate high token usage without corresponding code commits, identifying infinite loops or misconfigured agent loops.
- Analyze Cache Hit Ratios: Monitor the performance of prompt caching systems across the team, identifying repositories that require better file structuring to improve cache hits.
- Calculate Real-Time ROI: Compare the computed engineering hours saved against monthly API costs to justify compute budgets to finance administrators.
5.9 Advanced Token Budget Planning Checklist
To ensure compute budgets are allocated efficiently across large software departments, platform engineering leads should follow this structured planning checklist:
- Classify Repository Scale: Group projects into Small (under 50k lines of code), Medium (50k - 250k lines of code), and Large (over 250k lines of code) scales. Adjust the starting session budgets accordingly:
- Small Projects: Start with a $3.00 budget per task session.
- Medium Projects: Start with a $5.00 budget per task session.
- Large Projects: Start with a $10.00 budget per task session.
- Review Cache Warmth Targets: For active development teams, verify that the prompt cache hits average at least 70% during continuous work. If hits fall below 50%, audit repository include rules to ensure that large files are cached properly and that session history is placed at the end of prompt arrays.
- Configure Rate-Limit Thresholds: Restrict junior developer workstation environments to a maximum of $15.00 of compute per hour. This protects shared organization subscription keys from infinite agent loops while permitting uninterrupted development for senior architects.
- Establish Budget Reconciliation Schedules: Review aggregated token expenses on the first of every month. Cross-reference compute billing reports against saved engineering hours to verify that the Cost-Efficiency Factor (CEF) is consistently above 30, proving team productivity returns.
Actionable Close & Next Steps
- Set local budgets: Run all active CLI instances with the
--budget-limitconfiguration option enabled to protect resources. - Integrate proxy routing: Route terminal requests through the asynchronous FastAPI proxy to track and log session costs.
- Measure team savings: Run cost-efficiency audit queries monthly to compare API expenses against saved developer hours.
For more details on managing enterprise compute budgets, see FinOps Transformation 2026 and Surviving Shadow AI & Architecting Enterprise Governance. You can also review state management and failure recovery patterns in AI Agents in Production.
The tools and workflows outlined in this playbook represent a significant shift in developer environments. By moving from inline code suggestion to stateful agent CLI runtimes, developers can automate the routine tasks of syntax checking, compilation debugging, and test runs.
To leverage these tools effectively, engineering teams must focus on codebase cleanliness, modular API design, and comprehensive test coverage. When codebase logic is modular and accompanied by clear unit tests, local agent networks can locate changes, verify code correctness, and execute refactoring paths with high reliability.
By combining sandboxed container environments, prompt caching strategies, and robust cost-routing proxies, organizations can scale these agentic workflows while maintaining control over context security and compute costs.
Frequently Asked Questions
How does Claude Code process system shell commands safely?
Claude Code uses a sandboxed execution broker. All shell commands, package managers, and compile scripts run inside isolated namespaces (using Bubblewrap on Linux or AppContainers on Windows). The broker limits file access to the active project workspace, intercepts network requests to whitelist package registries, and blocks root-level operations, preventing modifications to the host operating system.
What is prompt caching, and how does it reduce API expenses?
Prompt caching allows the server-side model nodes to preserve the activation states of static prompt structures (such as system instructions, tool definitions, and workspace directory mappings) in memory. Subsequent API calls reuse this cached context, only billing for the new chat history or code edits. This reduces token fees by up to 90% and cuts response latencies down to less than 200 milliseconds.
How does the AST-based three-way merge conflict resolution work?
Instead of comparing raw text lines (which often leads to merge errors), the agent parses the local, incoming, and ancestor files into Abstract Syntax Trees (ASTs). It compares the nodes representing functions, classes, and variables, merging changes that affect separate modules. If both branches edit the same AST node, the agent executes compiler and test verifications to resolve the conflict before committing the files.
Can I configure custom tools for private company APIs?
Yes, by deploying custom Model Context Protocol (MCP 1.0) servers. MCP servers expose local tool definitions via standard I/O (stdio) or Server-Sent Events (SSE) using a JSON-RPC 2.0 interface. The agent handshakes with the server at startup, indexes the available tools, and calls their execution endpoints dynamically during task orchestration.
How does the cost-limiting token proxy prevent budget overruns?
The cost-limiting proxy sits between the CLI client and the API gateway. It intercepts all outgoing messages, calculates the token cost based on model pricing, and blocks execution if the session cost crosses the defined budget threshold. This prevents runaway agent loops from generating unmonitored API charges.