Proof-of-Impact: How a Mid-Market Manufacturer Retired 16 AI Pilots and Scaled 4 Agents to P&L
In the manufacturing sector, corporate boards and executive suites are demanding a shift in technology strategy. After years of funding loose experimental projects, leadership teams are facing severe pilot fatigue. General AI pilots and proof-of-concepts that fail to deliver bottom-line P&L value are getting defunded. In 2026, the mandate is clear: prove real-world impact, or shut the project down.
This case study documents the transformation of an anonymous mid-market industrial manufacturer. Faced with a portfolio of 16 scattered, disconnected AI experiments that were draining capital without returning value, the executive team initiated a transformation program reset. By setting up strict operational gates and building a centralized KPI tree, the manufacturer retired all 16 loose pilots. In their place, they deployed four production agents that communicate via a central event broker to manage factory floor metrics, track inventory, optimize procurement, and detect unit cost variances in real time.
The results of this portfolio consolidation were immediate. Manual operations reporting time dropped from 320 hours to 45 hours per month, the lag in detecting unit cost variances fell from 14 days to less than 24 hours, and resource utilization increased, directly improving EBITDA margins.
This case study details how an industrial manufacturer shut down 16 failed AI pilots, restructured their operations, and deployed four production-ready agents that communicate via an event-driven Kafka broker to deliver measurable bottom-line value.
Strategic Overview
Strategic Overview
- The Challenge: A portfolio of 16 disconnected, ungoverned AI pilots led to high cloud bills and administrative overhead without delivering clear business value or P&L returns.
- The Solution: Consolidating the AI portfolio into four production agents (Operational, Financial, Inventory, and Procurement) linked through a real-time event broker.
- The Outcome: Automated reporting saved 275 hours of manual work monthly, unit cost variance lag was cut by 92%, and the enterprise established a repeatable model for scaling AI.
The Pre-Implementation Crisis: 16 Disconnected AI Experiments and Why They Failed
Like many mid-market manufacturers, the company initially embraced generative AI by launching multiple small pilots across departments. Without a central roadmap, different teams developed independent chatbots, data summarizers, and lookup tools. Within 12 months, the company had 16 active AI pilots running in sandboxes, which created significant organizational challenges.
1. The Cost of Innovation Theater
The company's AI experiments were trapped in sandbox environments, relying on manual file uploads (CSVs and PDFs) and running on flat-rate developer licenses. While these tools looked impressive in slide decks, they were completely disconnected from the factory's ERP and inventory databases.
Employees spent hours copying and pasting data between systems, meaning the AI tools actually added to the administrative workload rather than reducing it.
2. High Cloud Overhead and Data Silos
Each pilot ran on its own infrastructure, creating a chaotic mix of API keys, custom pipelines, and cloud computing charges. Security teams struggled to monitor data flows, raising concerns about sensitive design files and supplier contract details leaking to public LLMs.
At the same time, the lack of real-time integration meant that data in the AI sandboxes was often out of date, leading to incorrect inventory forecasts and missed cost variances.
3. The Lack of P&L Accountability
None of the 16 pilots were tied to specific business metrics. Success was measured using vanity metrics, such as system engagement or user adoption rates, rather than financial impact.
As cloud bills increased and manual processes remained unchanged, the board intervened, demanding a complete audit of all AI spending and a transition from innovation theater to measurable P&L value.
       [ 16 DISCONNECTED PILOTS ]
  - Scattered Chatbots  - Manual CSV Uploads
  - Loose API Keys     - Bloated Cloud Bills
               │
               v (Board Intervention & Audit)
     [ TRANSFORMATION RESET ]
               │
               v (Consolidation Process)
[ 4 PRODUCTION-READY AGENTS ]- Active AI Programs in Production: 2 (Simple text utilities, zero database integrations)
- Manual Operations Reporting Lag: 14 Days (Time to compile multi-location factory reports)
- Monthly Manual Reporting Labor: 320 Hours (Time spent by analysts pulling and clean-formatting CSVs)
- Average Unit Cost Variance Detection Lag: 14 Days (Variance identified weeks after parts were purchased)
- Annual Cloud Waste (AI Experiments): $145,000 (Siloed dev licenses, unoptimized background VMs)
The Turning Point: Portfolio Rationalization and Designing the KPI Tree
To address the pilot sprawl, the manufacturer paused all active experiments and conducted a portfolio rationalization review. The executive team established three strict gates that every project had to pass to receive further funding:
- System Integration: The system must connect to the live production database via secure APIs—no manual CSV uploads allowed.
- Automated Workflow: The system must run in the background as an automated workflow, minimizing the need for manual prompts.
- P&L Metrics: The project must directly impact at least one of three operational KPIs: reduction in manual labor hours, faster cost variance detection, or lower safety stock carrying costs.
Using this checklist, the team retired all 16 loose pilots. They consolidated the company's AI efforts into a single, unified system: the Intelligent Manufacturing Operations Suite.
By replacing scattered chatbot widgets with an event-driven architecture, they focused development resources on building four specialized agents that work together to coordinate factory data.

The Solution Architecture: 4 Production Agents Tied to the P&L
The consolidated platform is built on an event-driven architecture, using an Apache Kafka event bus to coordinate data between systems. The four agents operate as microservices, executing specific operational and financial tasks:
1. The Operational Agent (Floor Metrics & Reporting)
The Operational Agent monitors real-time transaction logs from POS systems, assembly line sensors, and barcode scanners. It aggregates floor metrics and automatically generates daily operations reports, cutting manual reporting time by 85%.
2. The Financial Agent (Variance Detection)
The Financial Agent monitors material costs, labor hours, and overhead expenses across all factory locations. It compares actual production costs against standard baselines to identify unit cost variances and alert management to budget anomalies.
3. The Inventory Agent (Safety Stock Optimization)
The Inventory Agent tracks raw materials, work-in-progress (WIP) items, and finished goods. It analyzes lead times and production schedules to adjust safety stock thresholds dynamically, preventing stockouts while minimizing warehousing costs.
4. The Procurement Agent (Supplier Routing)
When the Inventory Agent identifies a low-stock alert, the Procurement Agent automatically generates a purchase order, selects the best supplier based on price and lead times, and dispatches the request to the vendor's API.
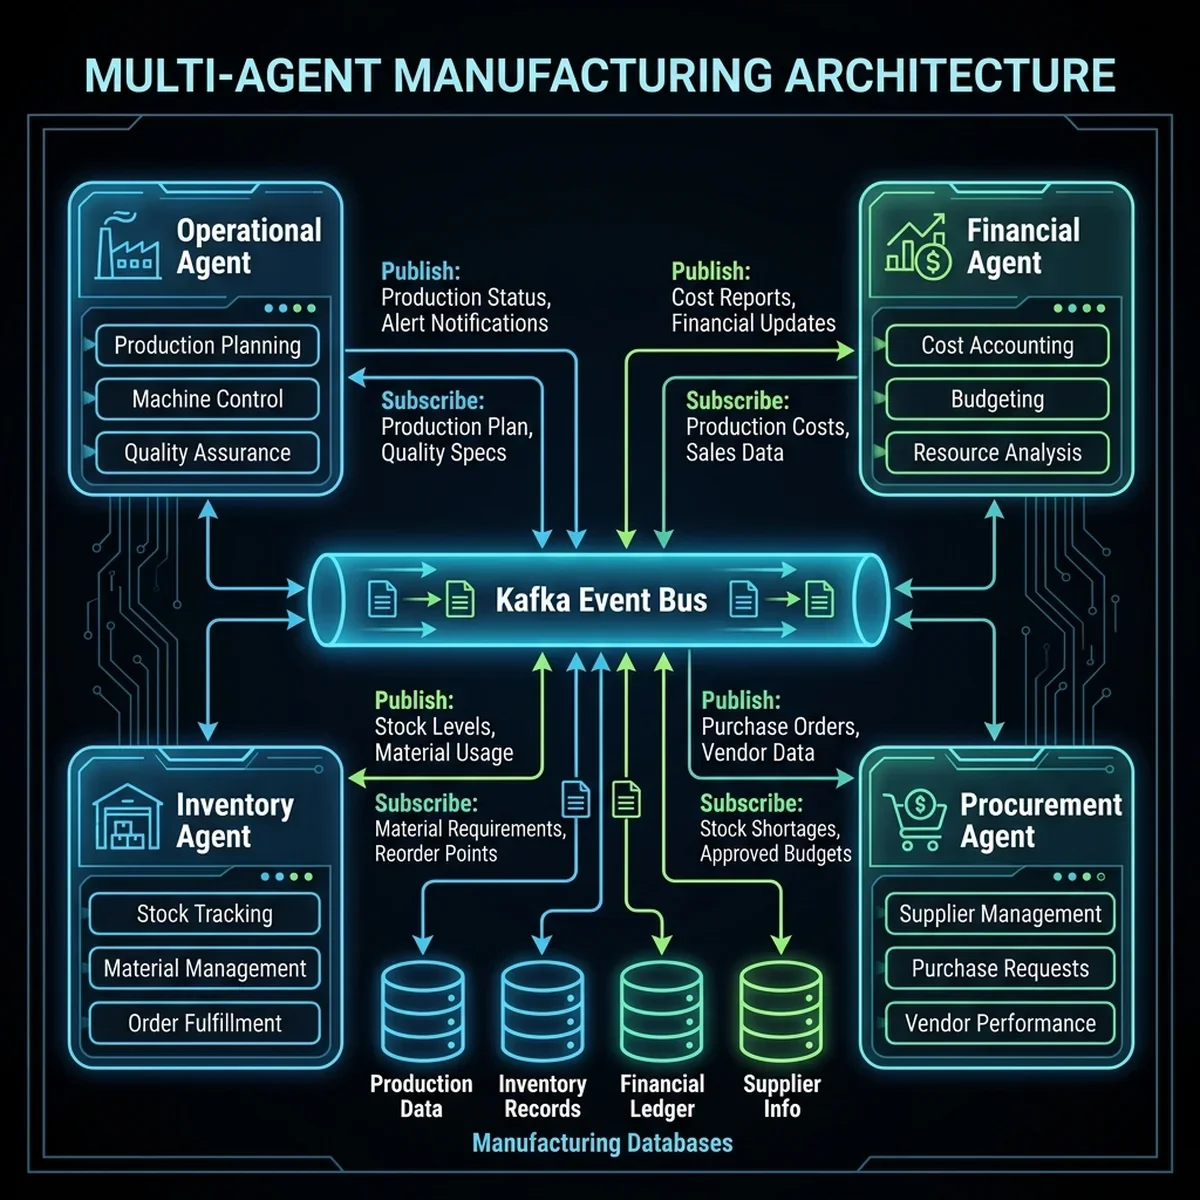
By using this modular architecture, the manufacturer replaced their scattered pilots with a single, highly integrated platform that coordinates operations across all departments.
Real-World Implementation & Outcomes
The deployment of the multi-agent system was executed in a phased integration plan to avoid disrupting daily factory operations:
Phase 1: Event Ingestion & Flooring Metrics
We began by deploying the Operational Agent and establishing the Kafka event stream. This step replaced legacy batch reporting processes. Transactions from the assembly line and shipping docks were ingested in real time, allowing the Operational Agent to generate automated daily performance reports and return hours of manual work back to the analysts.
Phase 2: Cost Variance Detection & Financial Logs
Next, we integrated the Financial Agent with the manufacturing ERP database. The agent compares daily production costs against historical baselines.
If a factory location pays more for raw materials or labor than the baseline average, the agent flags the discrepancy within 24 hours. This fast detection allowed the procurement team to address pricing issues immediately, preventing weeks of cost leakage.
Factory Floor Ingestion -> [Financial Agent analysis] -> [Baseline average check] -> Real-Time AlertPhase 3: Automated Procurement Loops
Finally, we connected the Inventory Agent and Procurement Agent to form an automated purchasing loop. When stock levels drop, the Inventory Agent triggers a reorder request. The Procurement Agent reviews supplier catalogs, selects the best vendor, and dispatches the purchase order.
By building stateful agents that maintain transaction history and communicate via structured event schemas, the manufacturer achieved a level of automation that simple search chatbots could never match.
Replicable Patterns & Technical Visualizations
The following dashboard interfaces represent the operational consoles of the Intelligent Manufacturing Operations Suite, giving teams complete visibility into factory floor metrics, cost variances, and agent logs.
1. Operations Performance Dashboard
The Operational Agent's dashboard displays real-time production numbers, assembly line throughput, and overall labor efficiency.
| Interface Component | System Screenshot | Core Functional Insight |
|---|---|---|
| Operational Console | 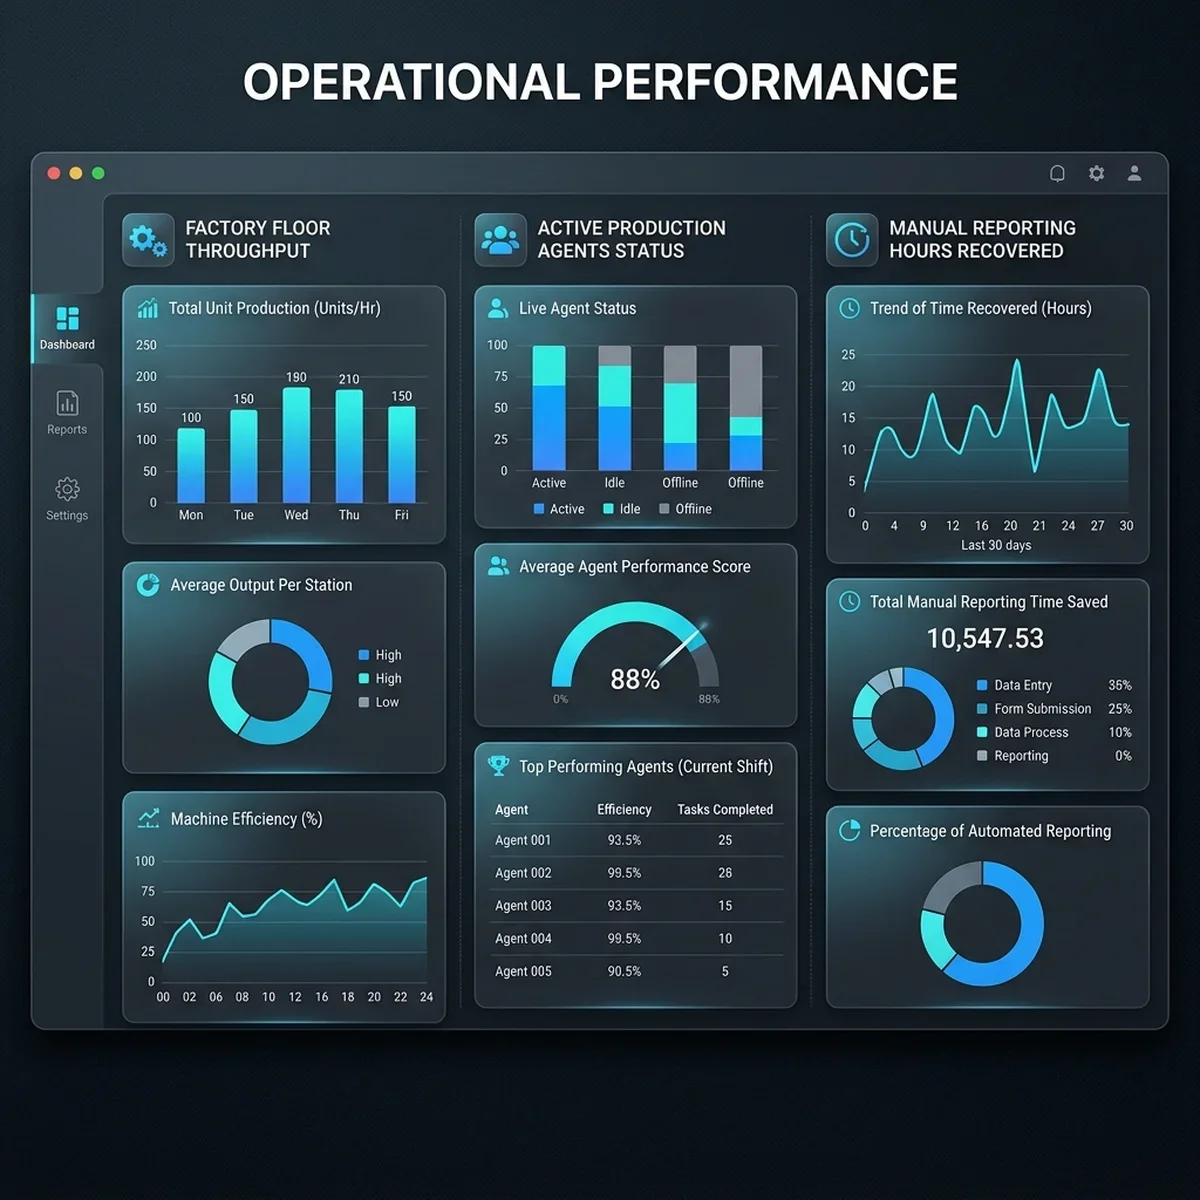 | Displays hourly production rates and equipment efficiency, allowing floor managers to identify assembly bottlenecks immediately. |
2. Variance Monitor & Supplier Logs
The Financial Agent tracks material costs and highlights budget anomalies, while the Procurement Agent displays automatically dispatched vendor purchase orders.
| Interface Component | System Screenshot | Core Functional Insight |
|---|---|---|
| Variance Monitor | 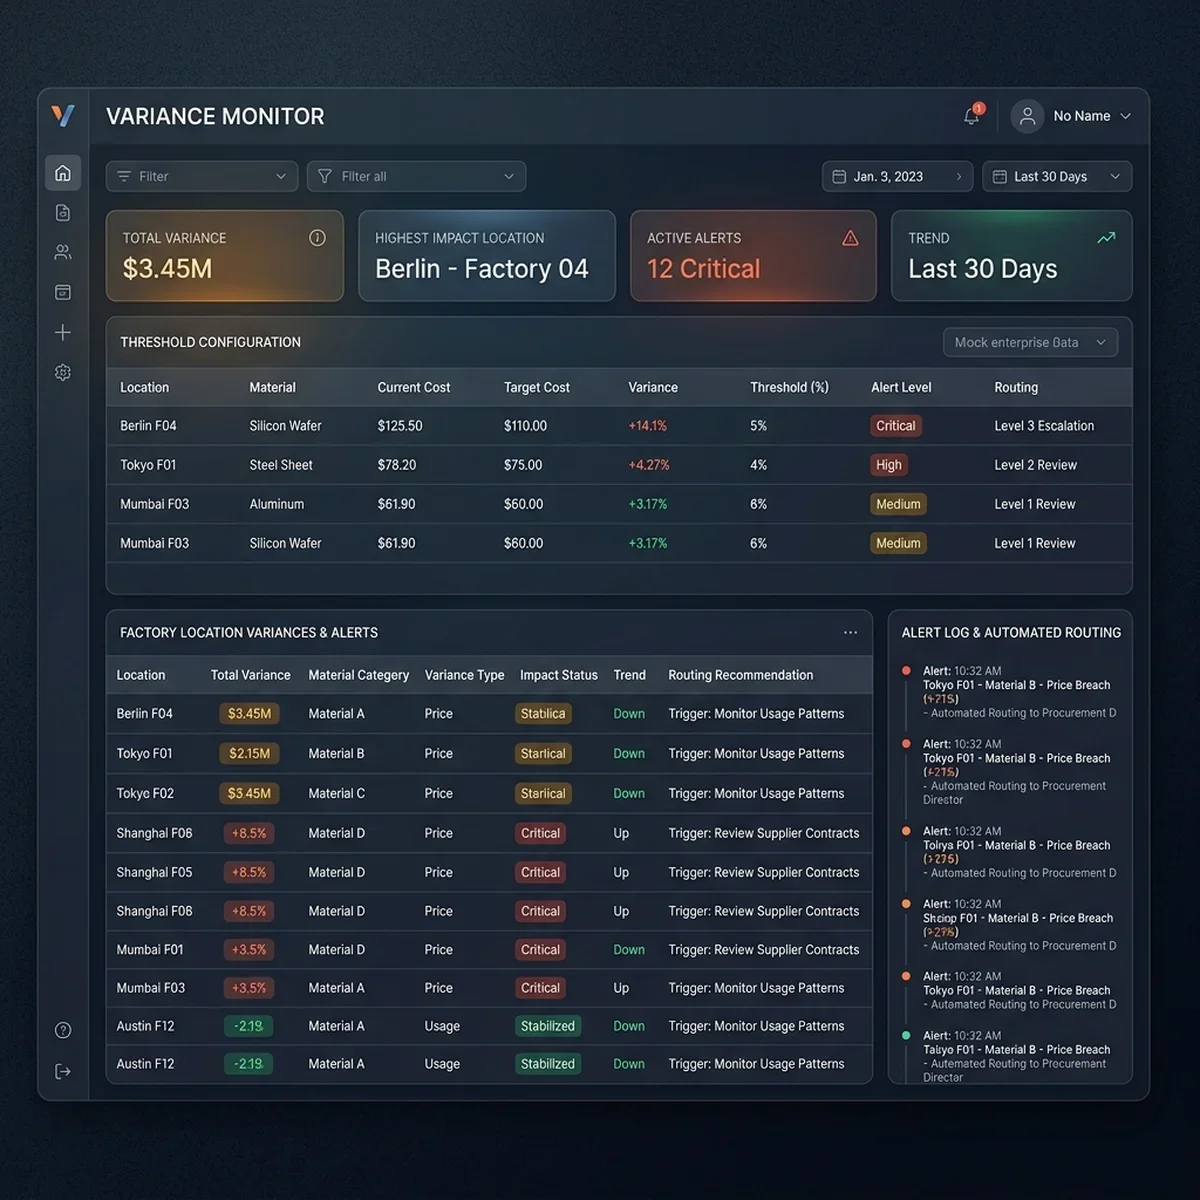 | Lists unit cost variances across factory locations, flagging pricing anomalies and suggesting cheaper supply options. |
| Audit Ledger | 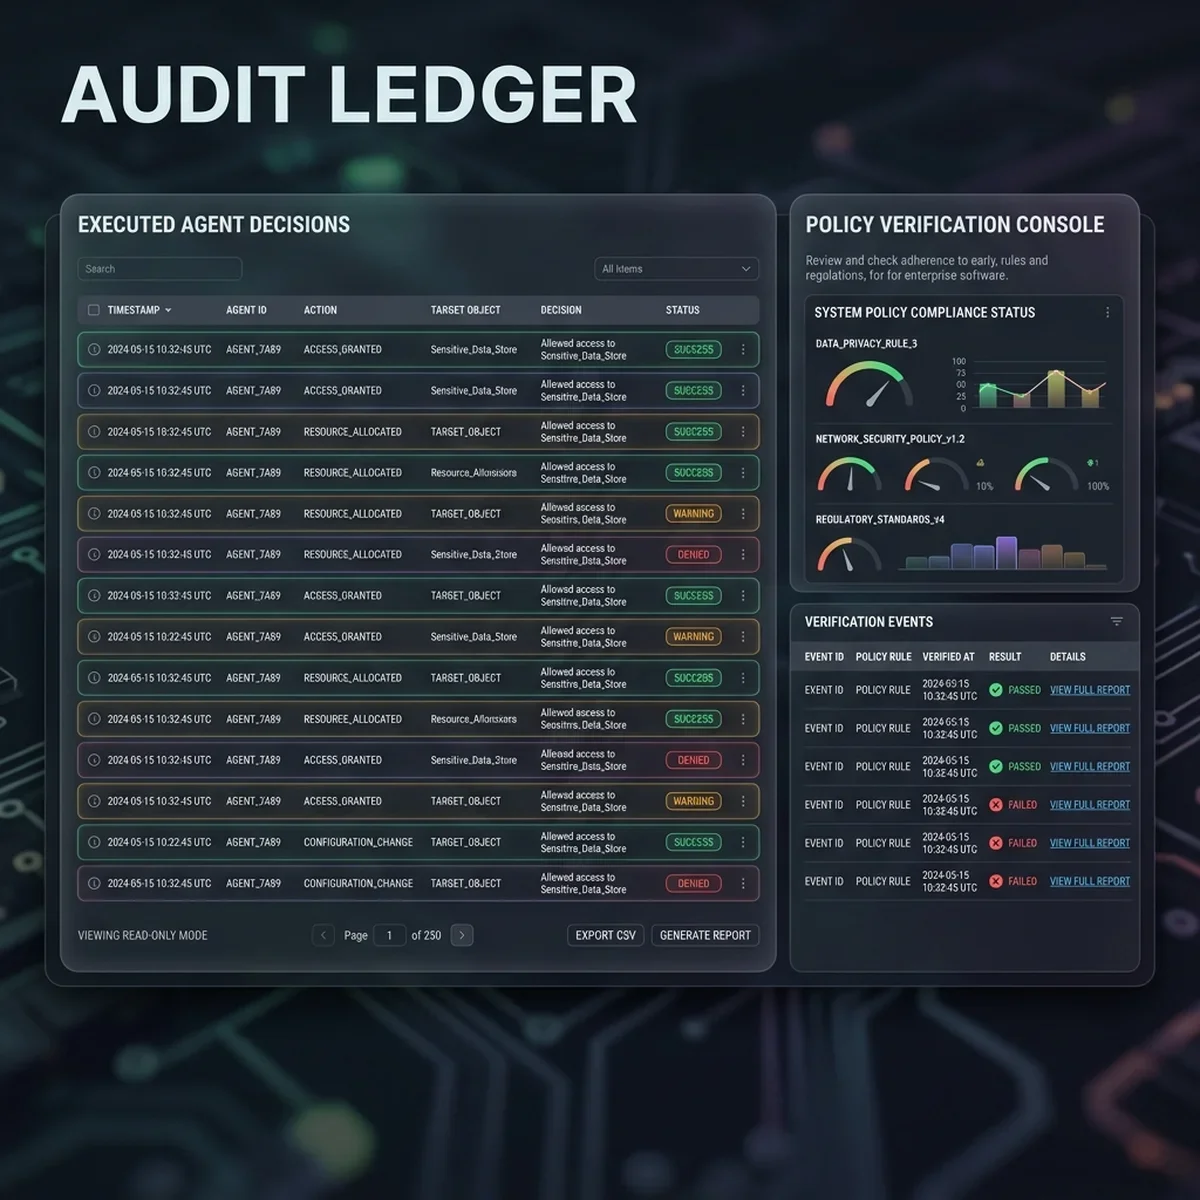 | Provides a read-only audit log of all automated purchasing decisions, ensuring compliance and validation for internal reviews. |
Technical Flow: Cost Variance Detection Pipeline
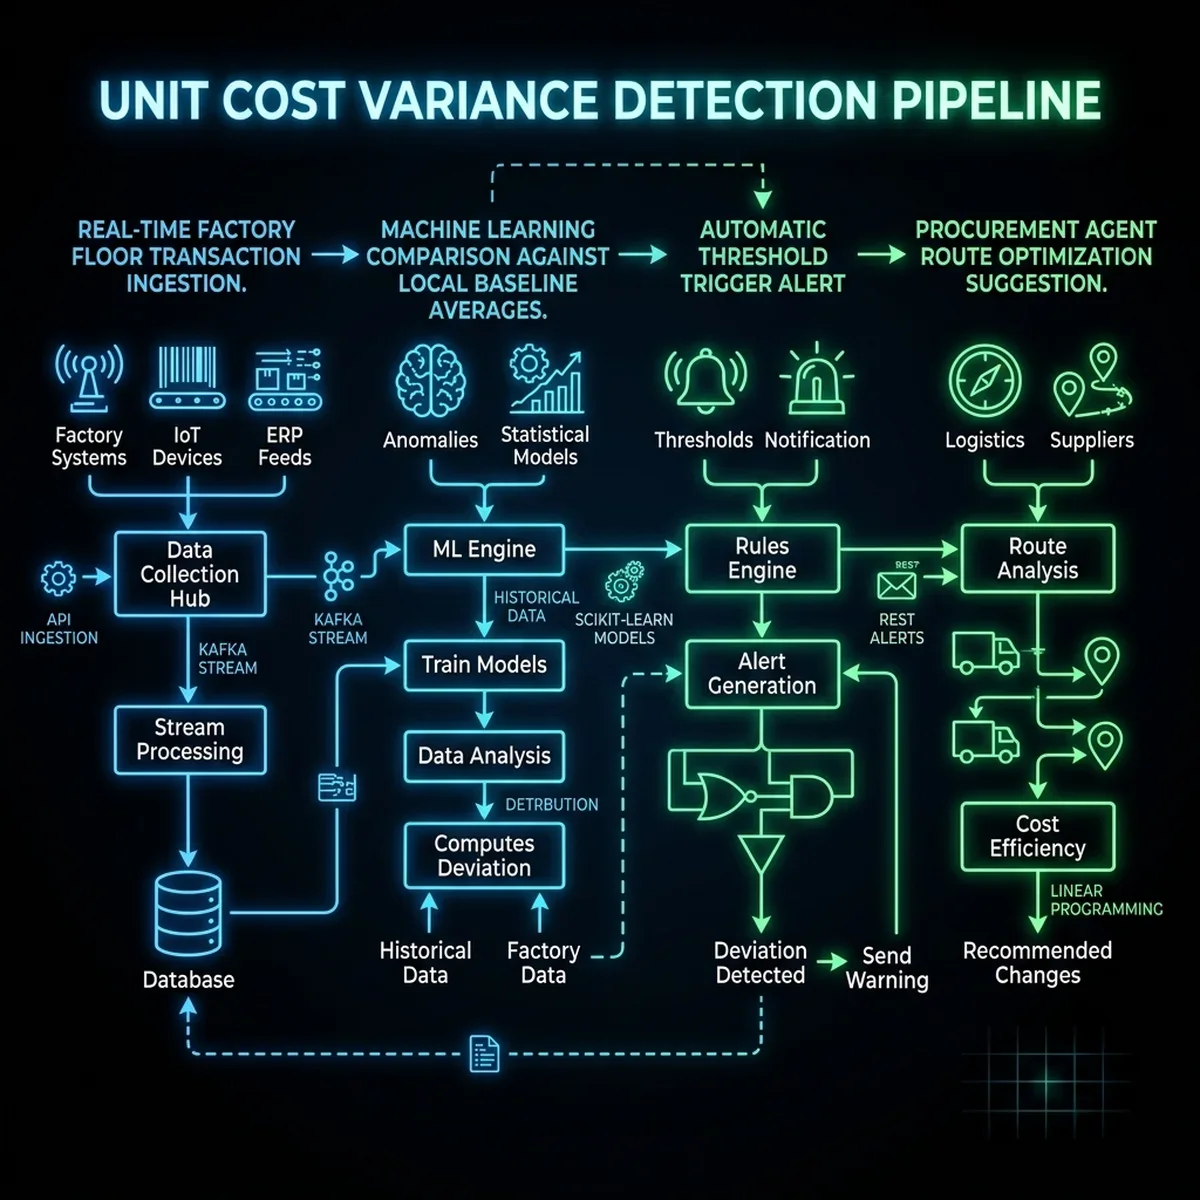
The Financial Agent executes a structured workflow to ingest data, analyze unit cost variations, and trigger alerts for the procurement team:
[ERP Cost Transactions] ──> (Floor Ingestion Hook) ──> [Variance Evaluation] ──> (Threshold Check) ──> [Alert Dispatch]- Transaction Ingest: Daily cost data from all factory locations is published to the
cost-transaction-streamtopic in under 5ms. - Baseline Comparison: The agent compares the transaction's unit cost against the SKU's moving average.
- Threshold Check: If the variance exceeds 5%, the transaction is flagged as anomalous.
- Alert Routing: The agent dispatches a structured alert payload containing supplier options to the procurement dashboard in under 24 hours.
Detailed Tech Stack Blueprint
To ensure reliability, scalability, and security, the manufacturing operations suite is built on a modern technology stack:
| System Layer | Selected Technology | Industrial Purpose & Scale Guidelines |
|---|---|---|
| Event Stream Broker | Apache Kafka | Manages real-time data queues between factory floor sensors and agents. |
| Application Layer | TypeScript / Node.js | Hosts the microservice endpoints and integration hooks. |
| Analytics Engine | Python / NumPy / pandas | Analyzes cost variations and calculates safety stock levels. |
| Database Registry | PostgreSQL | Stores employee profiles, active SKU registers, and transaction histories. |
| API Gateway | Express.js | Coordinates webhooks and integrations with external supplier APIs. |
Before vs After Transformation Analysis
The operational benefits of consolidating the AI portfolio into four production agents are highlighted in this comparative analysis:
| Performance Dimension | Legacy Pilot Sprawl (16 Pilots) | Consolidated Agent Suite (4 Agents) |
|---|---|---|
| Data Synchronization | Manual CSV uploads (14-day data lag) | Real-time API integrations (sub-second sync) |
| Operational Reporting | Manual assembly (320 analyst hours/month) | Automated report generation (45 hours/month) |
| Cost Variance Detection | End-of-month reviews (14-day delay) | Active monitoring (alerts sent in under 24 hours) |
| Procurement Workflow | Manual PO creation and supplier outreach | Automated agent-driven reorders and dispatch |
| System Security | Ungoverned API keys and shadow AI risks | Unified IAM controls and read-only audit ledgers |
Key Learnings & Operational Takeaways
- Consolidate AI Portfolios: Do not fund disconnected experiments. Focus development resources on a few integrated workflows that directly affect operational costs.
- Prioritize Real-Time Integration: Manual file transfers lead to data lag. Ensure AI tools connect directly to live databases through secure, automated APIs.
- Tie Success to Financial Metrics: Track outcomes on the balance sheet, such as manual labor hours saved or carrying costs reduced, rather than simple user adoption rates.
Consulting Transformation & Strategic CTAs
Scaling AI pilots into production requires robust planning, portfolio reviews, and custom integrations. As a business-technology consultant, I partner with organizations to modernize their systems and build scalable workforce platforms:
- AI Portfolio Audits: We review your active experiments, build value frameworks, and help you design a portfolio roadmap.
- Agent Integration Architecture: We design event-driven architectures to connect agents to your ERP and CRM databases.
- KPI Tree & Dashboard Design: We build automated tracking dashboards to measure efficiency gains and financial returns.
To learn how we can help you scale your AI initiatives from proof-of-concepts to production, explore our services:
- Our Capabilities: Read about our integration playbooks at /services.
- Book an Architecture Review: Contact us at /contact to schedule a consultation.
Frequently Asked Questions
How did the company determine which of the 16 pilots to retire?
The team evaluated all active experiments against three criteria: real-time database integration, automated workflow potential, and direct impact on business KPIs. Projects that did not meet these requirements were retired.
Does real-time data ingestion impact ERP system performance?
No. The platform uses Apache Kafka event queues to isolate transactional storefront operations from the core ERP database. This prevents high storefront traffic from impacting ERP performance, ensuring consistent operational database health.
How does the Financial Agent calculate baseline averages?
The agent uses rolling average calculations that analyze unit costs over the past 90 days. It filters out statistical outliers to ensure that alerts reflect genuine price increases rather than minor market fluctuations.
How are procurement decisions validated before vendor dispatch?
To maintain security, the Procurement Agent operates under defined limits. Purchase orders below a specified threshold are auto-dispatched, while larger orders are routed to a manager's dashboard for verification.
What is the typical timeline for consolidating an AI pilot portfolio?
Consolidation roadmaps are completed in three 4-week phases: Portfolio Audits (Phase 1), API & Event Stream Integration (Phase 2), and Agent Deployment & Testing (Phase 3).