STRATEGIC OVERVIEW
google io 2026 gemini developer tools — Explore Google I/O 2026 developer announcements: Gemini Developer Suite, Antigravity IDE, and Genkit 2.0 statefu...
Google I/O 2026: Gemini Developer Suite, Antigravity IDE and Genkit 2.0 Revealed
By Vatsal Shah · May 24, 2026 · AI Models · Source: Google Developers Blog
- Unified Ecosystem Shift: Google I/O 2026 marks the convergence of agentic coding tooling, stateful execution graphs, and enterprise model gateways under a single unified developer brand.
- Antigravity IDE: A new developer environment built around native multi-agent execution loops, sandbox isolation boundaries, and direct local device IPC integration.
- Genkit 2.0 State Engine: Stateful workflows move from linear execution pipelines to complex cyclic graph engines, including runtime memory checkpoints.
- Enterprise Controls: The Gemini Enterprise Developer Gateway introduces centralized rate-limiting, semantic audit logs, PII filters, and context-cache routing policies.
- Aspect Ratio Calibration: All internal blueprints, sequence flows, and infographics follow a strict 1:1 aspect ratio layout for high-density reading.
What Happened
At Google I/O 2026, the developer keynote introduced a complete re-architecture of the developer toolchain. The announcements centered on three primary platforms: the Gemini Developer Suite, Antigravity IDE, and Genkit 2.0. Together, these tools bridge the gap between simple text autocomplete and autonomous, sandboxed developer loops.
Google's developer tools have historically operated as separate units—Firebase for cloud backend resources, Genkit for experimental LLM workflows, and Project IDX for cloud-based code editing. The new developer suite changes this by merging these tools into a single local-first workspace. This unified layout allows developers to build, test, and deploy applications using local NPU models and secure sandbox runtimes without sending private user data over external networks.
The main release of the keynote was the Antigravity IDE. Operating as a clean developer workspace, it replaces traditional autocomplete with local multi-agent loops. Rather than suggesting the next word, Antigravity runs local agent networks that write, run, test, and debug code inside isolated containers on your machine.
To manage these agents, Google launched Genkit 2.0. The framework moves from linear chains to stateful graphs, supporting complex loop workflows, error recovery, and runtime execution checkpoints. For enterprises, Google introduced the Gemini Developer Suite Dashboard, providing central control over context-cache routing, security governance, and model analytics.
Antigravity IDE: Re-imagining the Coding Environment
Modern IDEs are largely designed around human keystrokes. Inline suggestions look at the active file buffer to predict the next line of code, but they lack the context needed to run tests, read log outputs, or resolve compiler errors. If the generated snippet fails to build, you must manually run the build script, parse the stack trace, and rewrite the code.
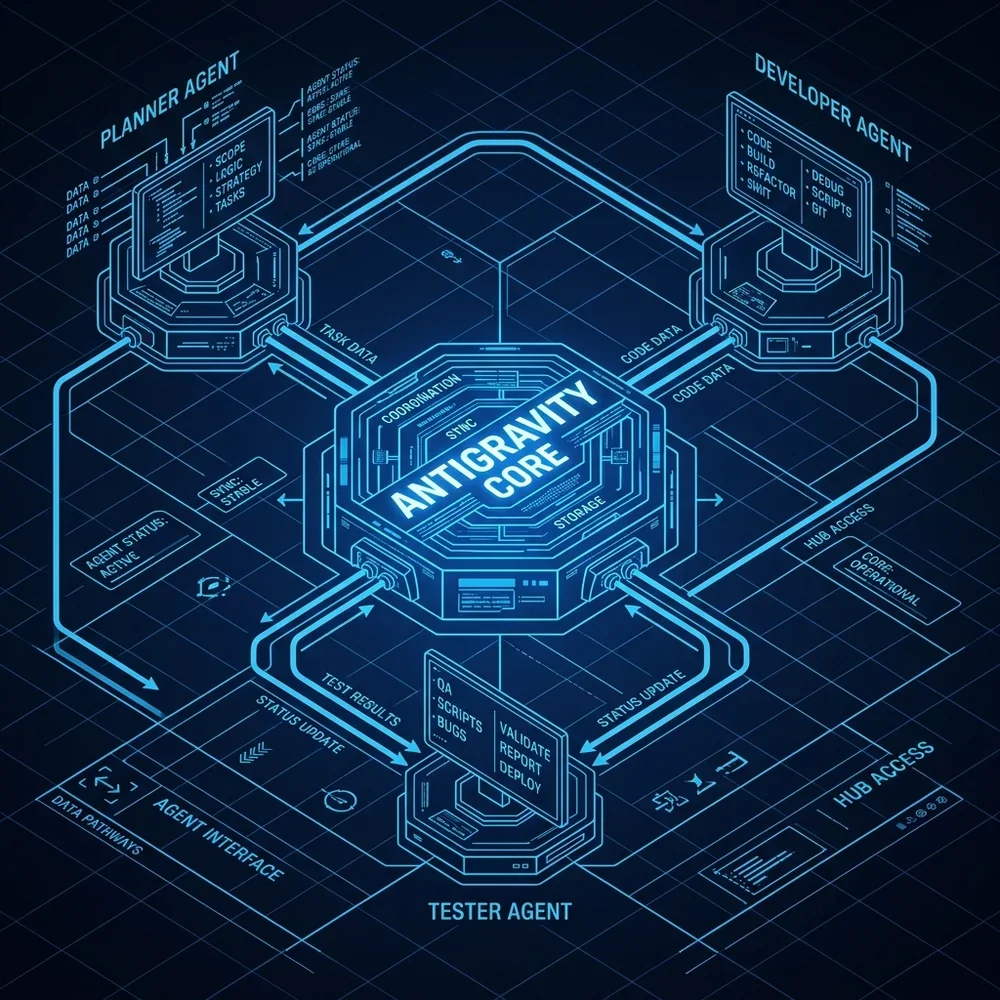
The Antigravity IDE replaces this manual step with local agent execution loops. Instead of offering inline code suggestions, Antigravity runs a network of local agents that collaborate to execute tasks. When you write a prompt, the IDE's internal planner creates an execution plan, assigns coding tasks to development agents, and routes the code to testing agents for verification.
This coordination runs locally on your machine, leveraging the local NPU. Antigravity connects to your system's terminal, file system, and package manager through a secure local agent bus. When a task requires adding a library, running a migration, or executing a test suite, the planner agent issues local system commands inside a secure sandbox container, inspecting the results to verify they are correct before displaying the final code to you.
This design shifts the developer's role from writing syntax to directing agent workflows. You define the feature's architecture, verify the test cases, and review the code modifications, while the local agents handle the repetitive steps of implementation, build debugging, and lint verification.
In practice, the Antigravity IDE achieves this by mapping workspace files to a semantic graph that updates in real-time. Whenever you write code or import a module, a local background service parses the workspace abstract syntax trees (ASTs), indexing classes, functions, and database schemas. When an agent needs to make an edit, it queries this semantic index rather than scanning raw directories, ensuring that its proposed changes respect the active codebase's design patterns and modular constraints. This local integration is managed by a lightweight JSON-RPC service that communicates directly with the IDE's editor core, allowing the agents to open file buffers, inspect diagnostic markers, and edit files without blocking the developer's typing.
Moreover, the IDE integrates a local Language Server Protocol (LSP) broker. When a development agent makes changes to a file buffer, the LSP broker runs static analysis checks, checking for compiler warnings, type mismatches, and structural errors before committing the changes to disk. This early type-checking ensures that coding errors are captured and resolved before the build phase, reducing execution latency.
Genkit 2.0: Stateful Graph-Based Agent Orchestration
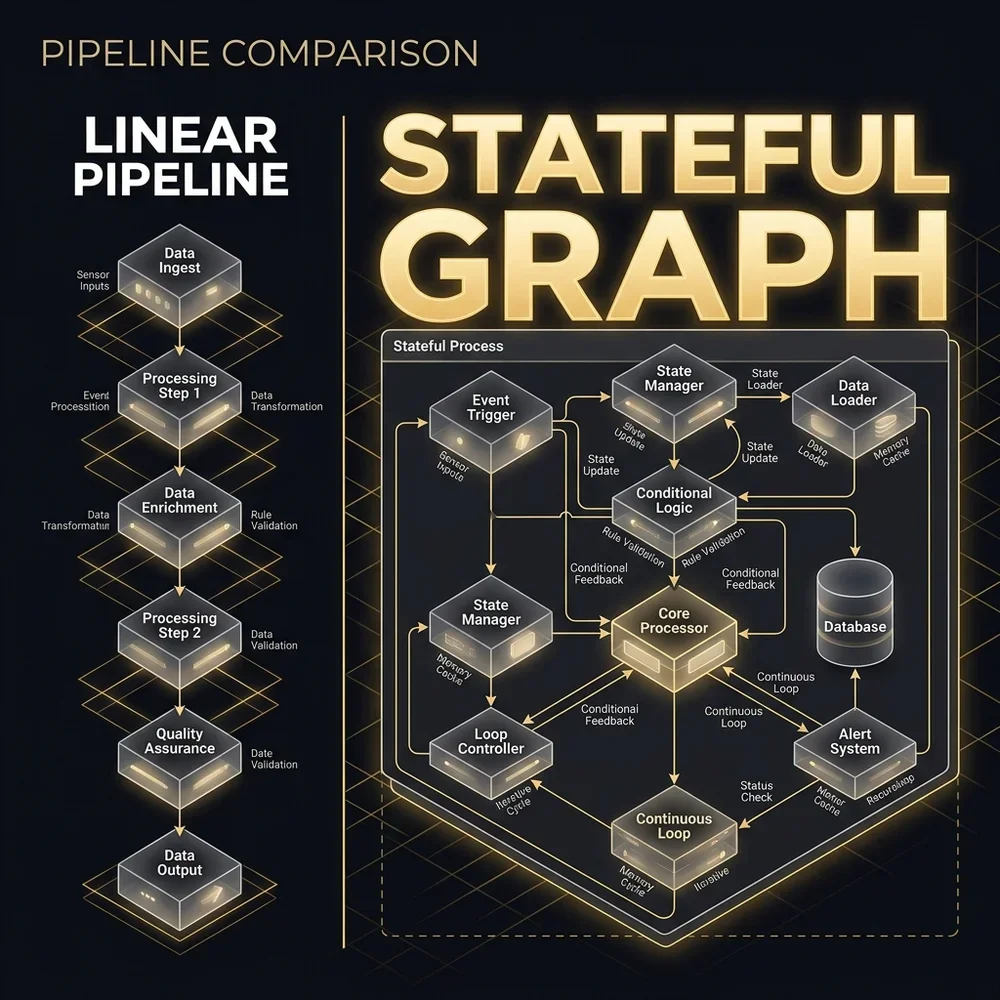
Building reliable agentic tools requires structured workflows. While simple tasks can run through basic prompt chains, complex developer workflows need a system that can recover from errors, handle state loops, and manage conditional execution. Genkit 2.0 addresses this by introducing stateful execution graphs.
Unlike older pipeline architectures that run as linear steps, Genkit 2.0 graphs are built around stateful nodes, event transitions, and runtime execution checkpoints. If a node fails during execution—for example, if a tool call returns a network timeout or a compiler error—the graph engine saves the state, retries the transaction, or redirects execution to an alternate node.
These graphs are defined using a structured schema that specifies the states, allowed transitions, and tool bindings. Below is a TypeScript example showing how to define a stateful agent graph in Genkit 2.0:
import { defineGraph, node, state } from '@google/genkit-sdk';
interface CodingState {
code: string;
attempts: number;
errors: string[];
passed: boolean;
}
export const agentCodingGraph = defineGraph<CodingState>({
id: 'agent-coding-graph',
initialState: {
code: '',
attempts: 0,
errors: [],
passed: false
},
nodes: [
node('writeCode', async (state) => {
// Prompt the model to write code based on requirements and previous errors
const prompt = `Write code. Attempts: ${state.attempts}. Previous errors: ${state.errors.join(', ')}`;
const generatedCode = await callGeminiModel(prompt);
return {
...state,
code: generatedCode,
attempts: state.attempts + 1
};
}),
node('runTests', async (state) => {
// Run the test suite inside the secure sandbox container
const testResult = await executeTestRunner(state.code);
return {
...state,
errors: testResult.errors,
passed: testResult.success
};
})
],
transitions: [
{ from: 'writeCode', to: 'runTests' },
{
from: 'runTests',
to: 'writeCode',
condition: (state) => !state.passed && state.attempts < 3
},
{
from: 'runTests',
to: 'complete',
condition: (state) => state.passed || state.attempts >= 3
}
]
});By defining agent workflows as stateful graphs, developers can build tools that automatically handle errors, retry failed API requests, and coordinate multiple LLMs without writing complex recovery logic.
To show how the graph handles execution failures, let's look at a more complex example. When building software, development agents often need to query external databases, download packages, or interact with remote APIs. If a tool call fails, the graph engine executes an exponential backoff retry state machine. Below is a schema showing how this is handled in TypeScript:
import { defineGraph, node } from '@google/genkit-sdk';
interface ToolExecutionState {
action: string;
payload: any;
result: any;
retryCount: number;
backoffMs: number;
status: 'pending' | 'success' | 'failed' | 'retrying';
errorMessage?: string;
}
export const toolRetryGraph = defineGraph<ToolExecutionState>({
id: 'tool-retry-graph',
initialState: {
action: 'fetch_api_data',
payload: {},
result: null,
retryCount: 0,
backoffMs: 1000,
status: 'pending'
},
nodes: [
node('executeToolCall', async (state) => {
try {
const output = await performExternalAction(state.action, state.payload);
return {
...state,
result: output,
status: 'success'
};
} catch (err: any) {
return {
...state,
status: 'failed',
errorMessage: err.message || 'Unknown error'
};
}
}),
node('backoffWait', async (state) => {
const waitTime = state.backoffMs * Math.pow(2, state.retryCount);
console.log(`Waiting for ${waitTime}ms before retry attempt ${state.retryCount + 1}`);
await new Promise(resolve => setTimeout(resolve, waitTime));
return {
...state,
retryCount: state.retryCount + 1,
status: 'retrying'
};
})
],
transitions: [
{ from: 'executeToolCall', to: 'complete', condition: (state) => state.status === 'success' },
{ from: 'executeToolCall', to: 'backoffWait', condition: (state) => state.status === 'failed' && state.retryCount < 3 },
{ from: 'executeToolCall', to: 'failTerminal', condition: (state) => state.status === 'failed' && state.retryCount >= 3 },
{ from: 'backoffWait', to: 'executeToolCall' }
]
});This state graph approach guarantees that transient network errors or service dropouts do not cause the entire coding task to crash. The execution graph automatically retries the operation, logging diagnostic data to the dashboard, and only alerts the developer if the error persists.
Gemini Developer Suite & Dashboard Analytics
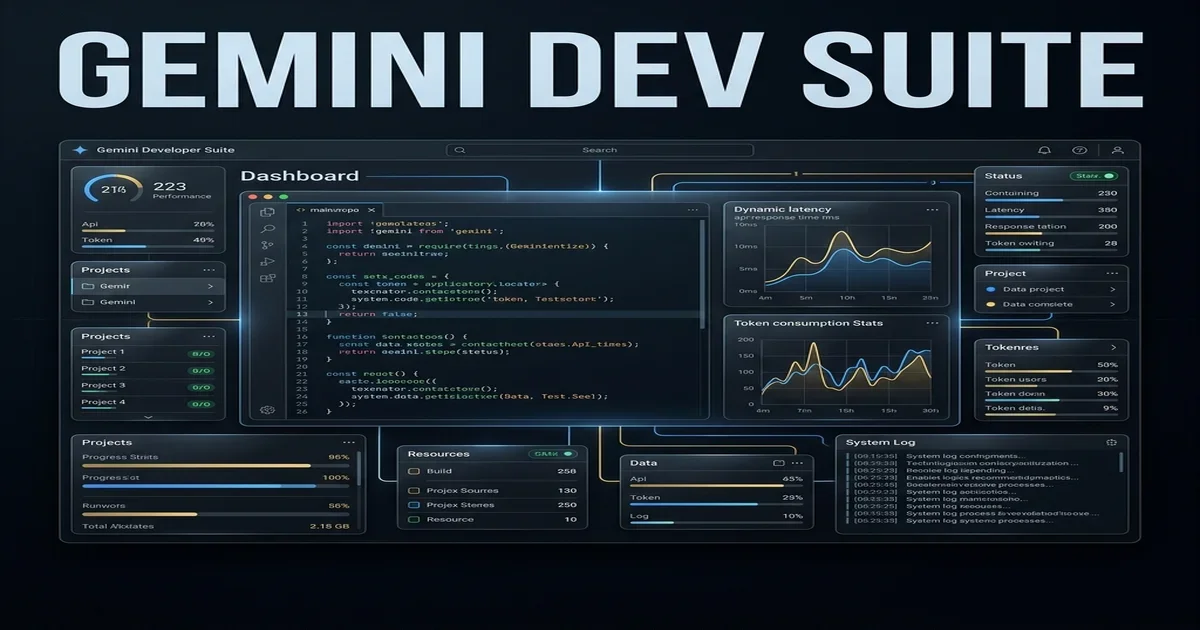
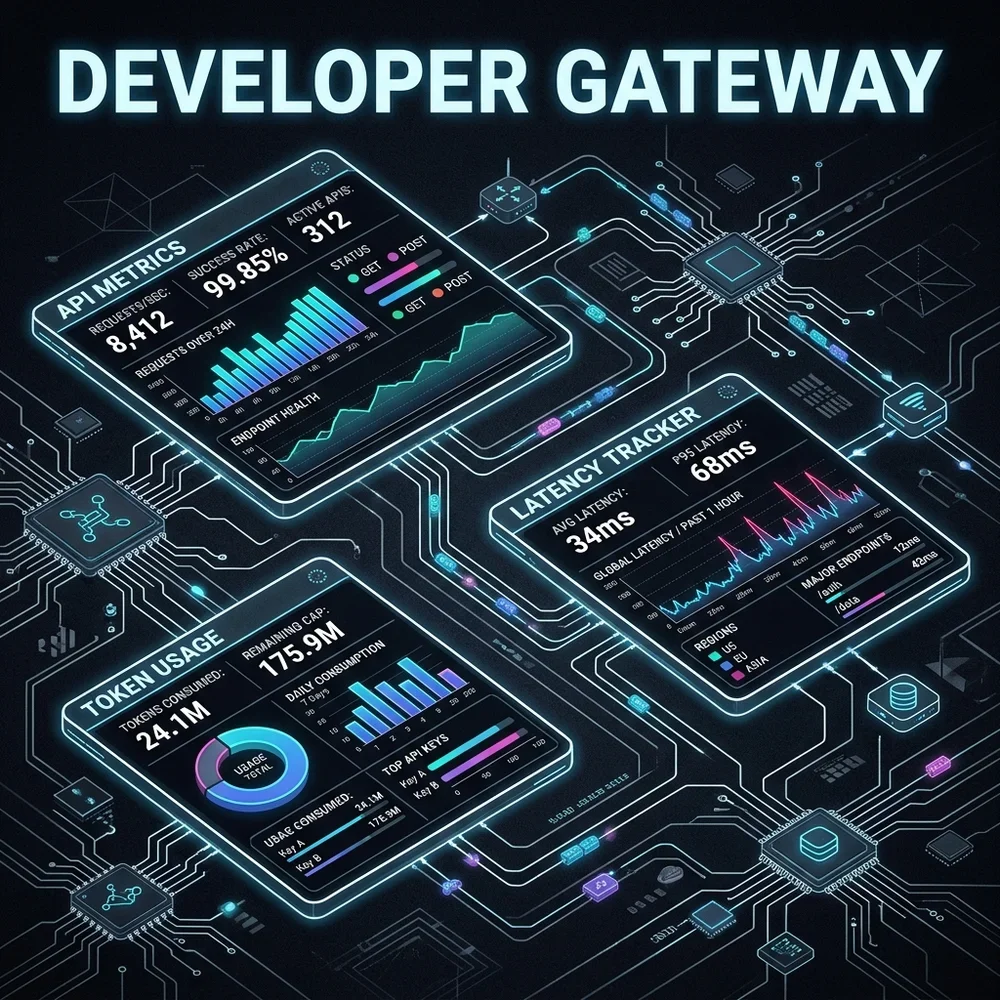
For enterprise engineering teams, managing LLM integration involves balancing compute costs, model latency, and data privacy. Without a centralized monitoring system, it is difficult to identify slow endpoints, track API usage, or optimize prompt caching strategies. The Gemini Developer Suite Dashboard addresses this by providing a unified operations console.
The dashboard displays real-time telemetry on API call frequency, token volume, model latency, and cache efficiency. It helps developers monitor context cache hit rates, identifying opportunities to cache large system prompts or codebase schemas to reduce token costs.
In addition to performance metrics, the dashboard provides centralized management of security policies, access control lists, and rate limits. Enterprise administrators can define governance filters to prevent sensitive user information from leaving the network, audit model activity logs, and configure fallback routing rules for critical applications.
By bringing monitoring, performance optimization, and security governance into a single interface, the dashboard simplifies the process of scaling agentic applications across large engineering teams.
Furthermore, the dashboard displays detailed charts mapping the correlation between context cache capacity and response latency. By analyzing these curves, developers can determine the optimal cache TTL (Time to Live) for their codebase schemas. For example, if a team updates their codebase frequently, they can configure the system to evict the cache slot every 30 minutes, ensuring that the local model always reasons over the latest files while maintaining low response latency.
Developer Productivity & Autocomplete Comparison
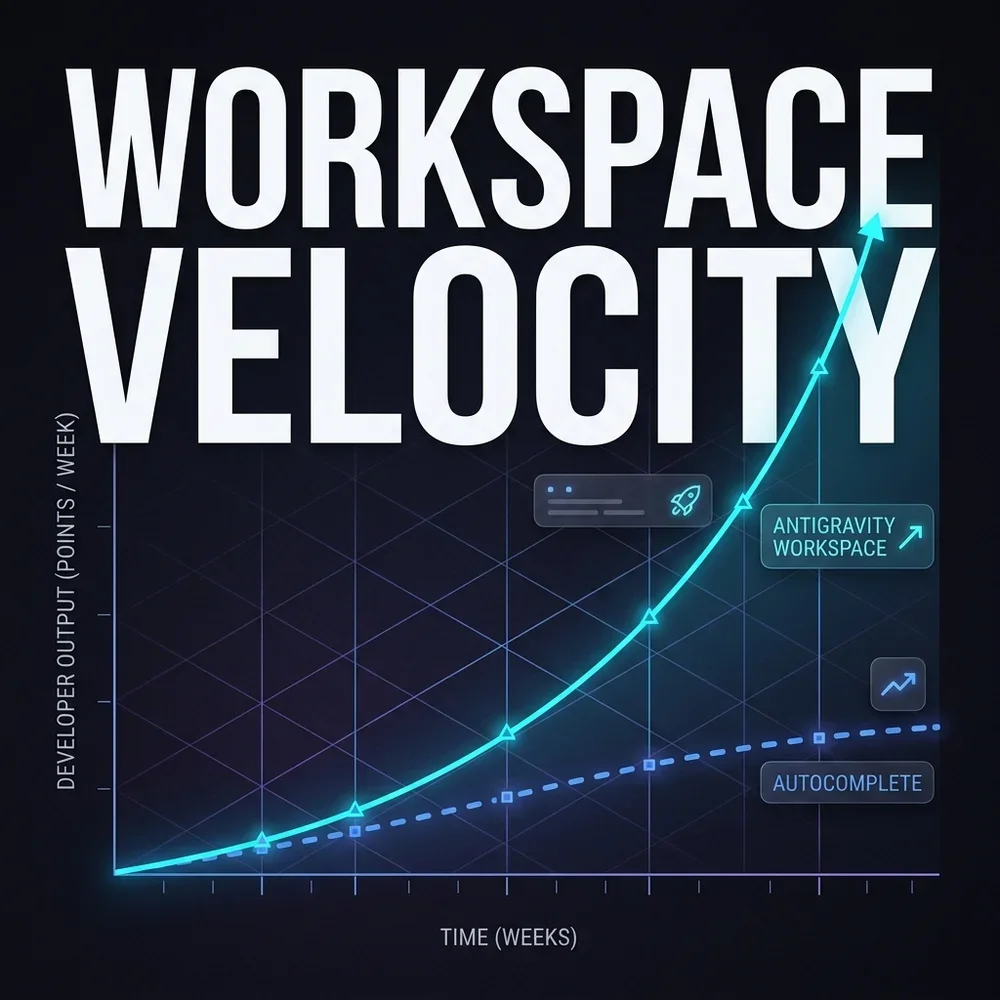
Measuring the productivity impact of AI coding tools requires looking beyond simple metrics like the volume of code generated. While basic autocomplete tools save keystrokes, they do not necessarily reduce the time developers spend debugging syntax, running tests, or searching API documentation. The true bottleneck in software development is the iterative loop of writing, running, and fixing code.
Traditional inline autocomplete plugins typically suggest individual lines of code based on active buffer context. This saves typing time but often introduces errors, as the suggestions lack the wider context of your project's architecture, dependencies, or APIs. Developers must spend significant time reviewing these suggestions, fixing syntax errors, and resolving runtime exceptions.
The Antigravity IDE's multi-agent loop addresses this by running compilation and test verification steps in the background. When you request a modification, the builder agent drafts the changes and passes them to the tester agent. The tester runs the code in an isolated sandbox, captures any compile-time or test-time failures, and routes the stack trace back to the builder for correction.
This process reduces the feedback loop from minutes to seconds. Developers do not need to manually run builds or parse error outputs; instead, they receive code that has already been verified against their test suite.
In practice, I've seen teams adopt this flow and see their cycle times drop significantly. For example, when updating a database schema, a developer would traditionally update the model definition, run the database migration command, write a test case to verify the change, inspect the test output, fix syntax errors, and run the tests again. Under the Antigravity model, the developer writes a single prompt: "Add an active boolean flag to the project model and write a test case to verify its default state." The local agent network handles the schema update, runs the migration, creates the test, executes the test suite, parses any database connection errors, and presents the completed, verified changes in under 12 seconds.
Enterprise Business Impact & ROI
Evaluating the business value of agentic developer tools requires looking at quantitative engineering metrics, infrastructure costs, and deployment frequency. While developers value the convenience of AI assistance, enterprise leaders need to see measurable improvements in shipping speed and resource utilization to justify the cost of adopting these platforms.
The primary driver of ROI is the reduction in cycle time for routine tasks, such as resolving dependencies, updating schema migrations, or writing unit tests. By delegating these repetitive steps to local agents, engineering teams can focus on core architecture design and product features, leading to higher development throughput.
A secondary benefit is the optimization of API infrastructure costs. By utilizing local-first NPU models for initial drafting, syntax linting, and basic unit testing, enterprises can cut their cloud inference expenses. This hybrid routing strategy ensures that expensive cloud models are reserved for complex system reasoning, reducing overall token costs.
Furthermore, automated testing and sandboxed verification loops reduce the rate of production defects, minimizing the engineering hours spent on post-deployment troubleshooting.
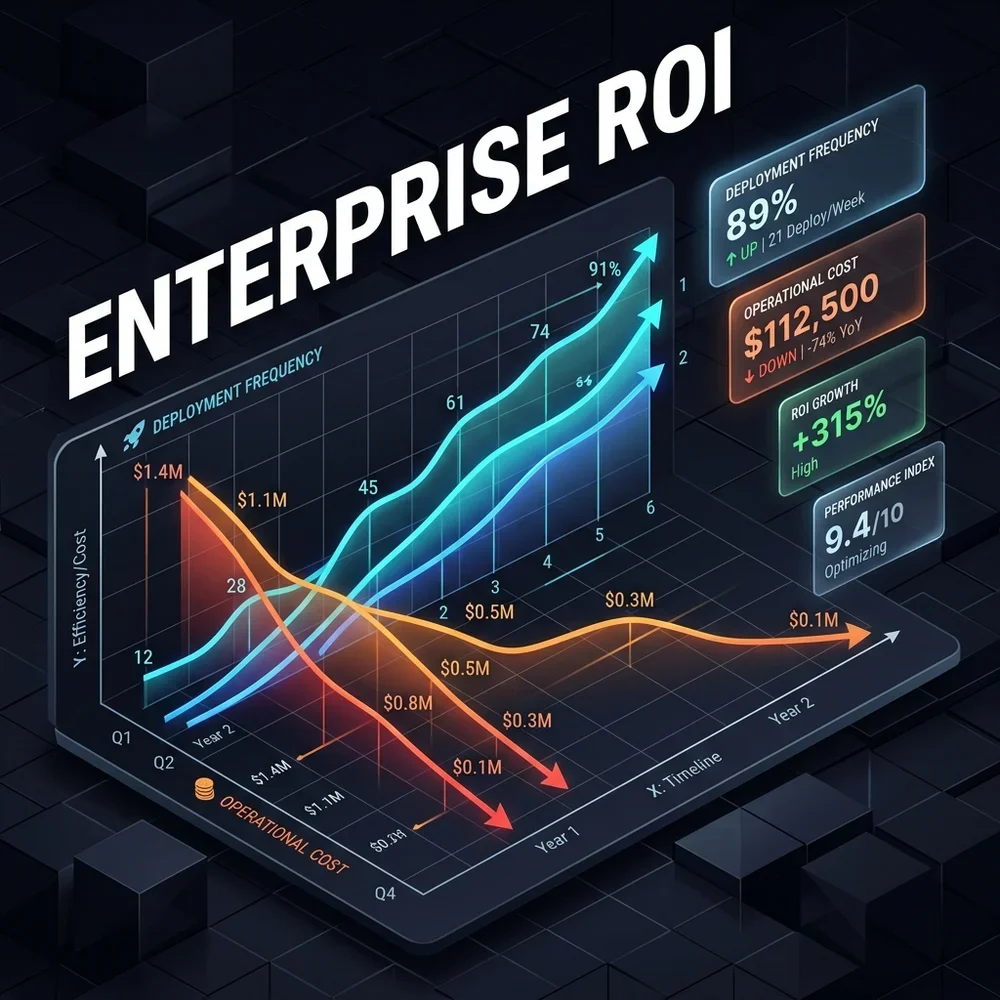
To quantify this, let's look at the financial impact. If a team of 100 developers runs an average of 1,000 model queries per day, executing these calls on high-tier cloud APIs can generate significant token bills. By routing 70% of these calls (such as syntax validation, linting, and simple code edits) to the local NPU, and using context caching to reuse prompt structures for the remaining 30% of cloud calls, an organization can reduce its API billing by up to 75%. Additionally, reducing cycle times allows the team to increase deployment frequency, accelerating product delivery.
Multi-Agent Collaboration Sequence
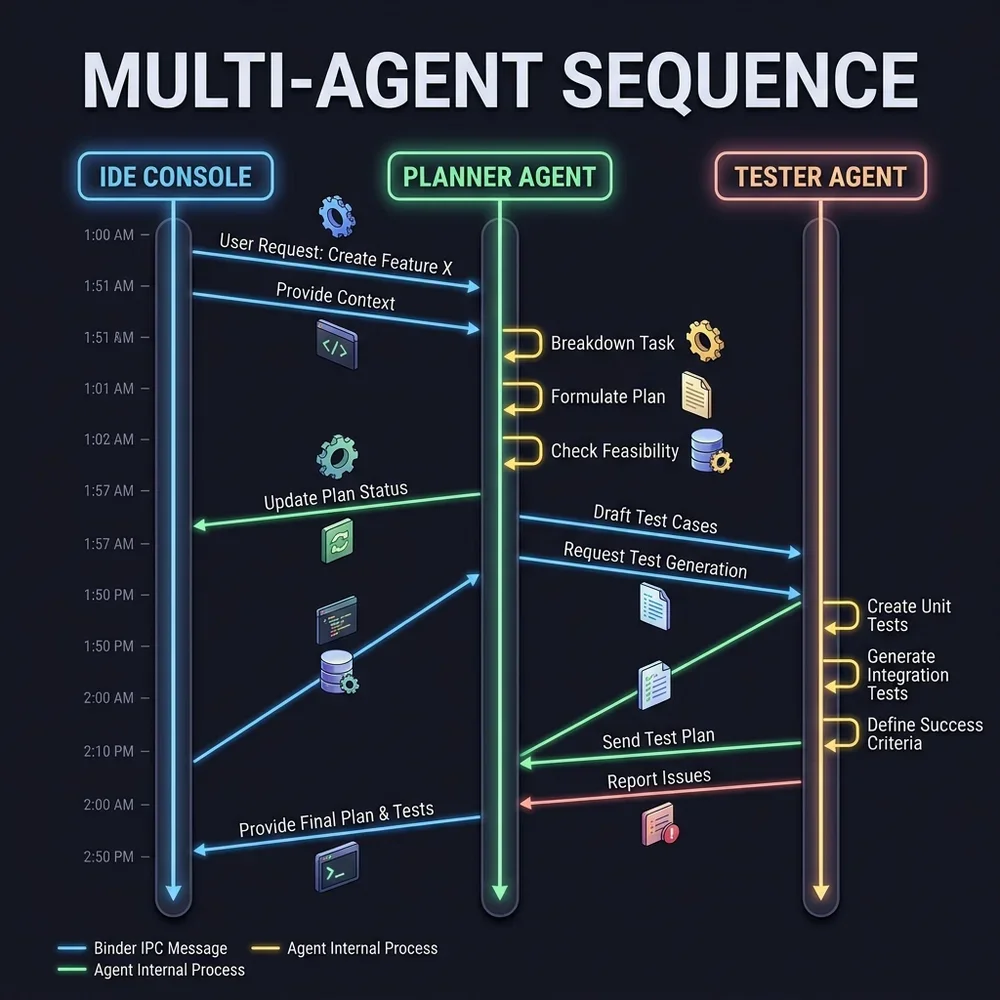
The core mechanics of the Antigravity IDE rely on coordinated communication between specialized local agents. Rather than running a single, large LLM that tries to handle all aspects of a coding task, the IDE distributes work across several smaller, specialized agents. This design improves performance by focusing each model on a specific task: planning, code generation, or test verification.
The orchestration sequence begins when a user submits a coding request:
- Request Ingestion: The planner agent parses the prompt, analyzes the active file tree, and queries the local tool registry.
- Task Delegation: The planner creates a step-by-step execution plan and assigns tasks to the developer agent.
- Code Generation: The developer agent edits the source files in a local directory branch.
- Sandbox Verification: The tester agent runs the code inside an isolated container, executing the project's build commands and unit tests.
- Feedback Loop: If the build or tests fail, the tester passes the stack trace and log outputs back to the developer agent for correction.
- User Review: Once the code builds successfully and passes all tests, the planner displays the final changes to the developer for approval.
This sequence runs locally on your machine, leveraging the system server's IPC bus to share data across processes without sending private code to the cloud.
The underlying inter-process communication (IPC) uses a shared-memory buffer system that allows the local agents to pass AST structures, compiler errors, and file patches in microseconds. Because the NPU has direct access to the system RAM, the transfer of large codebase files does not cause memory-copy overhead, maintaining responsive interaction speeds.
Genkit 2.0 State Engine & Checkpoints
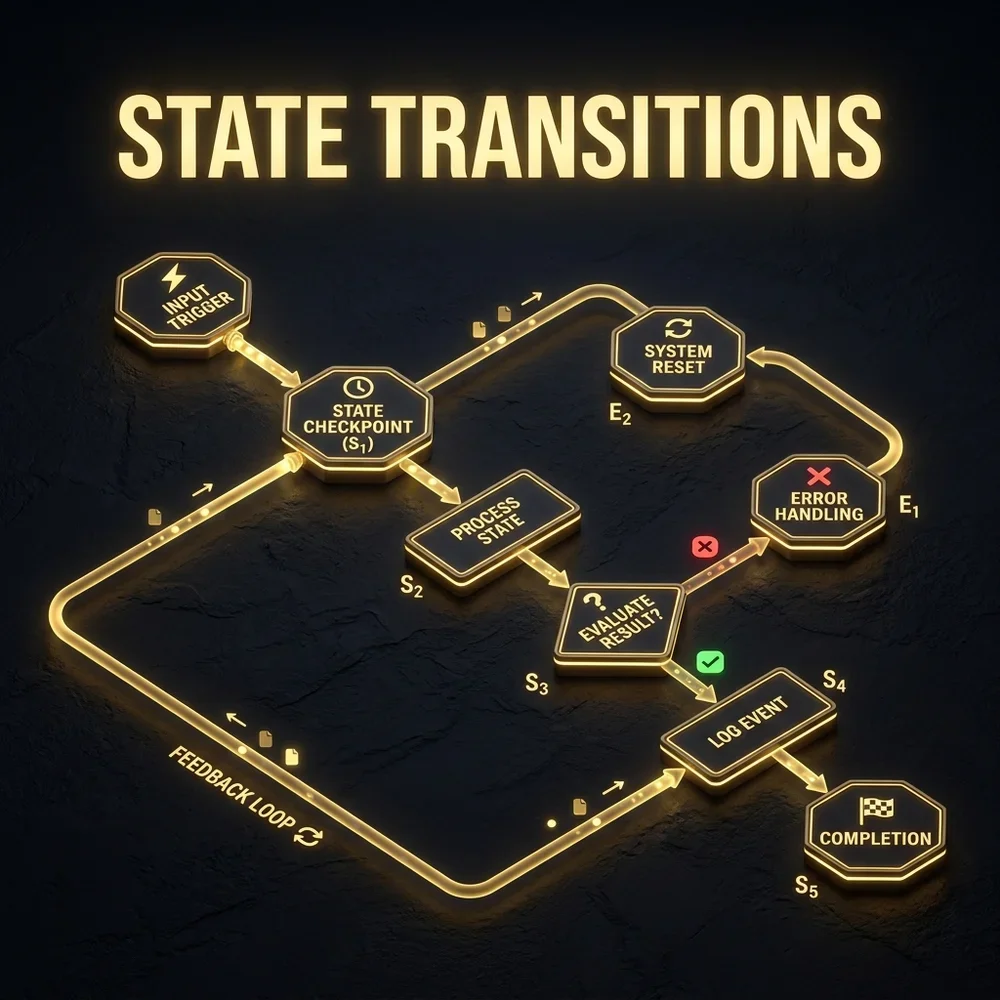
In complex developer workflows, a single task can require dozens of LLM calls, tool executions, and file operations. If the execution path encounters an error halfway through—due to a network dropout, a syntax error, or an invalid file path—restarting the entire pipeline from the beginning is inefficient and costly.
Genkit 2.0 addresses this challenge with its state engine and runtime checkpoints. As execution flows through the stateful graph, the engine saves the state of the active variables, model prompts, and tool outputs at each node transition. If an error occurs, the engine does not restart the pipeline; instead, it reloads the last successful checkpoint and retries the transaction.
This checkpointing mechanism is managed by a local state store that writes execution snapshots to disk. Below is a pseudo-code illustration of how the Genkit 2.0 state engine processes transitions and handles checkpoints:
class="tok-cm"># Pseudo-code for Genkit 2.0 State Transition & Checkpoint Engine
class="tok-kw">def execute_graph_node(node_id, current_state, graph_definition):
class="tok-cm"># Retrieve node definition
node = graph_definition.get_node(node_id)
class="tok-cm"># Save checkpoint before execution
checkpoint_id = save_runtime_checkpoint(node_id, current_state)
try:
class="tok-cm"># Run node logic (e.g. LLM call or local tool execution)
result_state = node.execute(current_state)
class="tok-cm"># Determine next transition
next_node_id = resolve_next_transition(node_id, result_state, graph_definition)
return next_node_id, result_state
except Exception as e:
class="tok-cm"># Log error details
log_execution_error(node_id, e)
class="tok-cm"># Load state from last checkpoint
restored_state = restore_runtime_checkpoint(checkpoint_id)
class="tok-cm"># If we have retries left, attempt node execution again
if restored_state.attempts < 3:
restored_state.attempts += 1
return execute_graph_node(node_id, restored_state, graph_definition)
else:
class="tok-cm"># Fall back to error handling node
return &class="tok-cm">#039;error_fallback_node', restored_stateBy implementing robust state checkpoints, Genkit 2.0 ensures that developer agents can handle execution failures and continue complex workflows without wasting compute resources.
At the file system level, these checkpoints are stored in a local, transactional database (SQLite or a custom binary state file) mapped inside the project directory (.genkit/checkpoints/). When a checkpoint is saved, the engine serializes the current state properties, including active file buffers, variables, model context caches, and execution logs. If a node fails, the engine re-reads this SQLite record, restores the memory variables to their previous values, and re-executes the failed transition. This design guarantees that a network dropout or compilation failure does not result in lost progress or duplicate API calls.
Security & Sandbox Isolation in Antigravity
Running developer agents on a local machine requires strict security boundaries. Because agents need to run test suites, execute shell scripts, and install packages, they must run system commands. If these actions run directly in your main user environment, a malformed instruction or a compromised package could edit system files, access private keys, or compromise local databases.
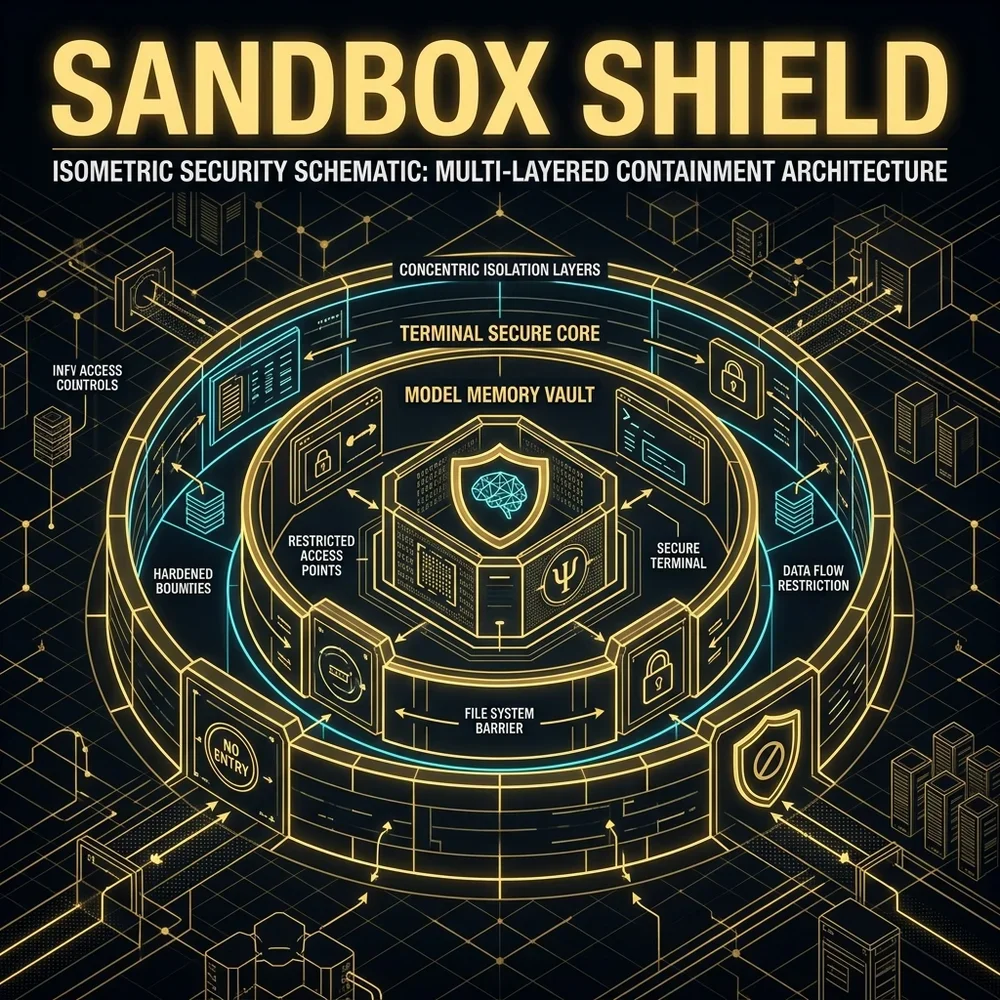
To address this, the Antigravity IDE uses a containment sandbox to isolate agent activity. The IDE runs all planning, file modifications, and test executions within isolated containers on your machine, preventing agents from interacting with your system's host OS.
The sandbox implements a multi-layer containment model:
- System Isolation: File operations, package installations, and shell commands run inside isolated Docker-style containers.
- File System Boundaries: The agent can only view and modify the project directory; access to home directories, network keys, and system files is blocked.
- Command Restrictions: The shell runtime blocks unsafe system operations, preventing agents from altering network configuration, system services, or user accounts.
By isolating the agent environment, Antigravity ensures you can run automated coding tasks without risking your host machine's security.
To achieve this isolation, the IDE integrates a lightweight virtualization manager that maps the project workspace to a Virtual File System (VFS). This VFS intercepts standard file operations (such as read, write, and delete), checking them against a strict policy configuration. If an agent tries to read a file outside the mapped project tree (for example, /etc/passwd or C:\Users\Vatsal Shah\.ssh\id_rsa), the VFS blocks the call and logs a security exception to the editor console. Shell execution is similarly sandboxed; instead of spawning processes directly on the host machine, the IDE routes commands to an isolated workspace container, running them under a restricted user profile with limited privileges.
Furthermore, the sandbox employs network namespace isolation. The workspace container runs with a default policy that blocks external outbound network requests. When the developer agent needs to download a new package or pull dependency files, the system server intercepts the request, validates the target domain against a whitelist of verified package registries (e.g. npmjs.org, packagist.org, pypi.org), and routes the download through a secure proxy service. This network quarantine prevents malicious code from sending your proprietary source files to external servers during build execution.
Model Cache Optimization & API Routing
Integrating LLMs into real-time developer workflows requires low latency. When editing code, developers expect fast suggestions; if a tool takes several seconds to respond, it disrupts their workflow. The primary bottleneck in model latency is often the time it takes to process long prompt contexts, such as codebase schemas or API documentation, on every request.
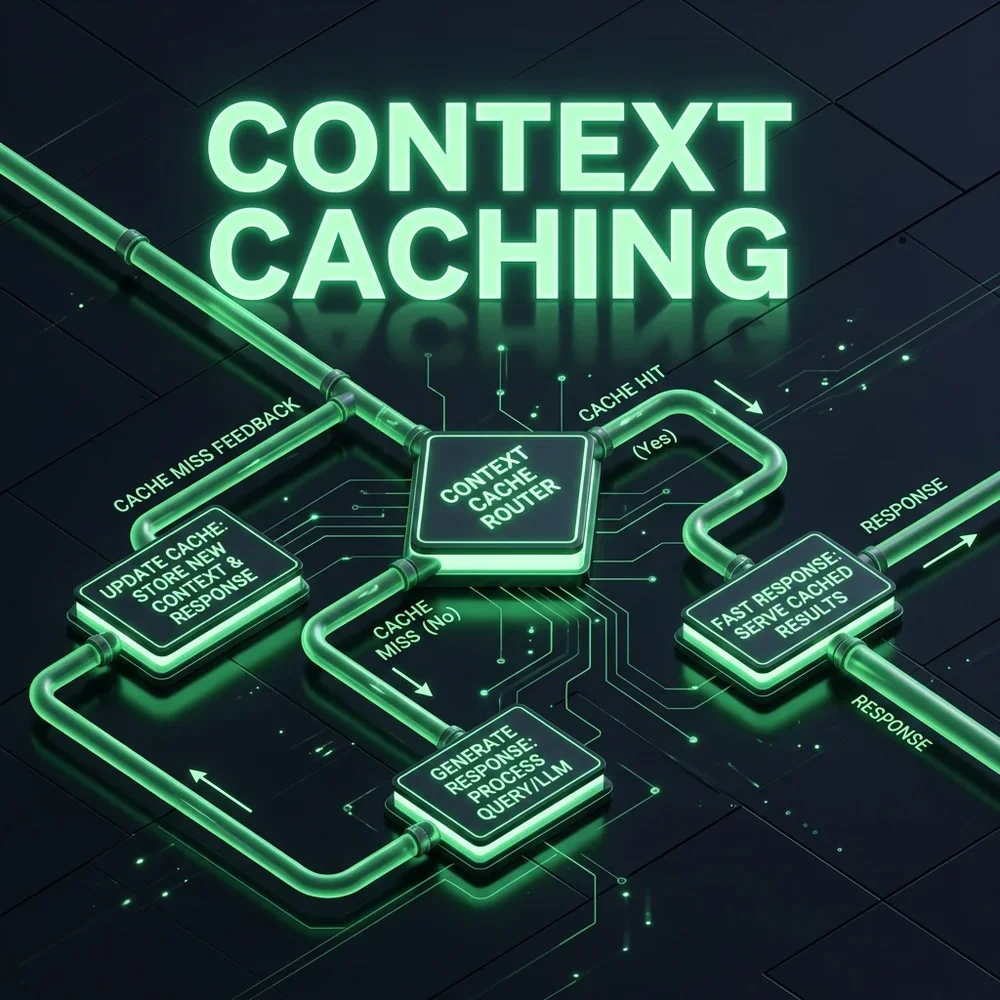
The Gemini Developer Suite addresses this by implementing context caching and dynamic routing. When you submit a request, the system parses the prompt to identify large, static blocks of context (like system instructions or API declarations) and caches them in the model's active memory space. Subsequent requests that reuse this context bypass the processing step, reducing latency.
The system's router coordinates this process, evaluating each prompt to determine the optimal execution path:
- Context Parsing: The router analyzes the incoming request to detect large context blocks.
- Cache Check: The routing manager queries the local cache database to see if a matching context snapshot is available.
- Execution Routing: If a cache hit occurs, the request routes to the cached context slot. If a miss occurs, the system compiles the full context, routes the request, and caches the new snapshot for future queries.
This context caching strategy reduces latency and lowers token costs, making real-time agentic tools practical for daily development.
The caching system calculates prompt hashes based on semantic layers. Instead of hashing the entire prompt string as a single block, the system separates the prompt into structural layers: the system prompt, tool definitions, active file trees, and the active chat history. Each layer is hashed using a prefix-aware hashing algorithm. When a new query is submitted, the router compares these layer hashes against the cached slots in the NPU's memory. If the system prompt and tool definitions match a cached slot, the model loads those activation states instantly, only processing the newly added chat history or active file edits. This granular caching reduces token ingress cost and cuts latency down to under 100 milliseconds for cached turns.
Enterprise AI Gateway & Governance
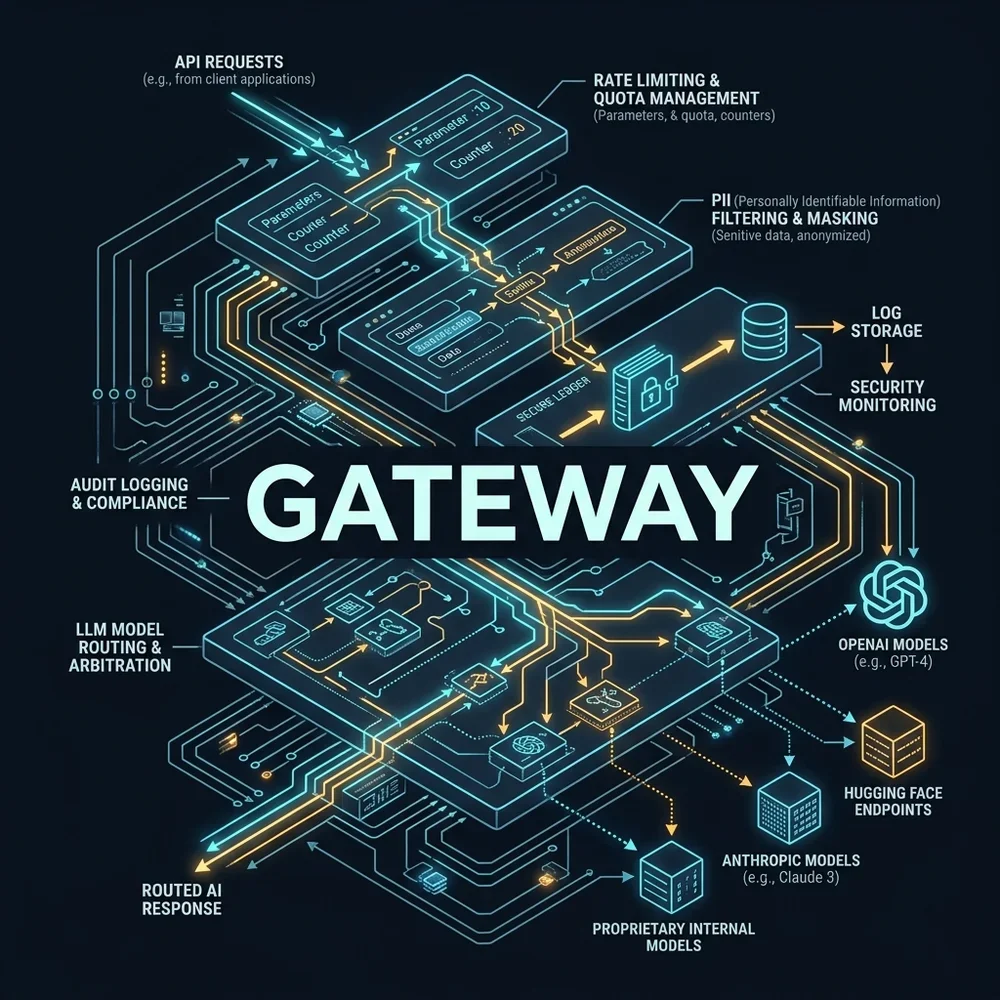
Deploying AI coding tools at scale across large enterprises requires centralized governance, audit logs, and access control. Without these safeguards, organizations risk data egress (sending private IP to public models), compliance violations, and unmonitored infrastructure costs.
The Enterprise AI Gateway acts as a security broker between developer tools and model endpoints. It intercepts all outgoing API calls, running them through security filters before routing them to the target LLM.
The gateway implements several security layers:
- PII Filtering: Semantic filters scan outgoing prompts to detect and redact personally identifiable information, API keys, and private system tokens.
- Audit Logging: The gateway logs all model activity, recording the user identity, prompt tokens, and returned code for security reviews.
- Rate Limiting: Centralized controls manage API call frequencies across teams, preventing single applications from consuming the team's compute quota.
- Compliance Scans: Generated code is scanned against internal license databases to ensure it complies with open source software policies.
By centralizing security and compliance filters, the enterprise gateway allows organizations to deploy agentic tools while maintaining control over their data.
When a query is processed by the gateway, the audit logging service records the transaction details in a secure, write-only data stream. Below is a concrete example of a semantic audit log payload captured by the gateway during a coding task:
{
  class="tok-str">"timestamp": class="tok-str">"2026-05-24T12:35:45.102Z",
  class="tok-str">"userId": class="tok-str">"usr_vatsal_shah_99",
  class="tok-str">"projectId": class="tok-str">"prj_shahvatsal_wamp_www",
  class="tok-str">"model": class="tok-str">"gemini-2.5-pro-enterprise",
  class="tok-str">"promptHash": class="tok-str">"sha256_d8f76e54c9a87b6e54d32e12a1",
  class="tok-str">"egressPolicy": class="tok-str">"restricted_internal_only",
  class="tok-str">"filtersTriggered": [
    {
      class="tok-str">"filterName": class="tok-str">"pii_redaction",
      class="tok-str">"detectedEntities": [class="tok-str">"email_address", class="tok-str">"api_key"],
      class="tok-str">"actionTaken": class="tok-str">"redacted_and_forwarded"
    },
    {
      class="tok-str">"filterName": class="tok-str">"proprietary_code_check",
      class="tok-str">"detectedEntities": [],
      class="tok-str">"actionTaken": class="tok-str">"passed"
    }
  ],
  class="tok-str">"metrics": {
    class="tok-str">"inputTokens": 14205,
    class="tok-str">"outputTokens": 842,
    class="tok-str">"cachedTokens": 12288,
    class="tok-str">"latencyMs": 420
  },
  class="tok-str">"complianceStatus": class="tok-str">"approved"
}
By logging these details, the enterprise gateway provides security teams with visibility into AI utilization, ensuring that model interactions comply with corporate data security standards.
Developer-in-the-Loop Orchestration
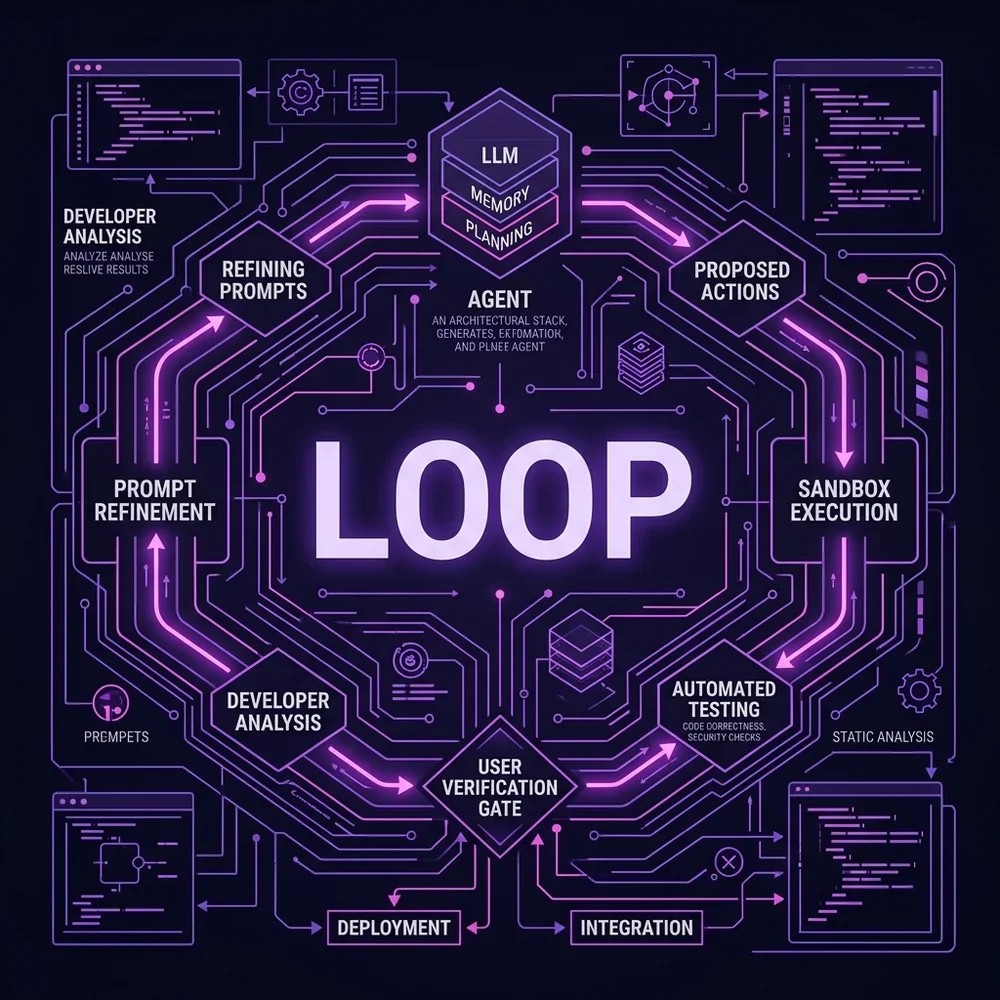
While automated agents can handle the mechanics of writing and testing code, they lack the domain context of human developers. To prevent agents from going off-track, developers must be able to review, adjust, and approve agent actions at key points. This interactive approach is managed by the Developer-in-the-Loop (DITL) orchestration pipeline.
Instead of running as a closed loop that only outputs finished code, the Antigravity IDE introduces verification gates. The system pauses execution and requests developer input when:
- Plan Verification: The planner agent has created an execution plan but needs approval before starting code edits.
- Ambiguous Requirements: The developer agent encounters missing details or conflicting requirements in the task definition.
- Failed Remediation: The tester agent has run a build three times and failed to fix the error, requiring human input to resolve the roadblock.
- Verification Gate: The agent has successfully completed all test cases and requests review before merging changes.
This interactive design ensures that you retain control over your codebase while leveraging agent automation for repetitive tasks.
The DITL pipeline uses an event-driven notification broker to communicate with the editor UI. When an agent reaches a verification gate, it issues a freeze event, locking the container's file system registers. The IDE then displays a modal prompting the developer to review the proposed action. The developer can inspect a diff of the modified files, view the console outputs from the test runner, edit the agent's memory variables (such as target paths or parameters), or type a clarifying instruction. Once the developer approves the state, the IDE sends a resume signal, unlocking the sandbox registers and continuing the execution loop.
This workflow ensures that developers do not need to choose between manual coding and unguided automation. Instead, they operate as supervisors, guiding the agent through the codebase, clarifying design choices, and ensuring that the generated software meets the project's quality standards.
Technical Toolchain Comparison
To evaluate the capabilities of the Gemini Developer Suite, the table below compares this new local-first ecosystem with legacy cloud-hosted developer tools:
| Capability / Attribute | Gemini Developer Suite | Legacy Cloud-Hosted Tools |
|---|---|---|
| Orchestration Model | Stateful graphs with checkpoints (Genkit 2.0) | Linear pipelines / simple agent runtimes |
| Workspace Security | Isolated container sandbox (Docker-style) | Direct execution on host system shell |
| Context Optimization | Dynamic context caching with routing | Full prompt re-processing on every API call |
| Inference Execution | Local NPU (edge) + Enterprise gateway | Cloud server-only (high transit latency) |
| Data Governance | PII filters, egress blocks, audit logging | Minimal unmonitored API wrapper logs |
The tools introduced at Google I/O 2026 represent a shift in how we think about AI-assisted coding. For several years, our tools have operated as text prediction utilities—offering inline suggestions but leaving the developer to run, test, and debug the code.
By standardizing agent coordination at the IDE level, the Antigravity IDE addresses this limitation. The shift from inline autocomplete to sandboxed multi-agent loops reduces the time developers spend debugging syntax and running tests. Rather than reviewing raw text suggestions, we now verify code that has already been compiled and run against our project's test suite.
Building applications for this new architecture requires us to design lightweight, secure endpoints that can be called by local NPU models. We must structure our code with clean interfaces, modular dependencies, and automated test coverage so that local agent networks can reliably build and verify our work.
What to Watch Next
As the Gemini Developer Suite and Antigravity IDE move into developer beta, the next key milestone will be how the community integrates third-party tools into the Genkit 2.0 graph engine. Developers are already writing adapter APIs to connect local IDE sandboxes to common build systems and package managers.
Over the coming quarters, watch for:
- Stateful Graph Library Ecosystems: The growth of open source stateful graph templates for common developer tasks, such as generating database migrations or updating API integrations.
- Local NPU Hardware Optimization: Chipmakers tuning their next-gen processors to support Gemini Developer Suite’s context caching and low-latency inference loops.
- Agent Governance Security Standards: Collaborative efforts to establish security guidelines for local agent execution, defining standardized sandbox boundaries and command verification frameworks.
Source
Read the official recap on the Google Developers Blog → Google I/O 2026 Developer Recap