Predictive Project Management: Re-Engineering PMOs with Real-Time Risk Analytics in 2026
By Vatsal Shah | August 13, 2026 | 22 min read
Table of Contents
- The Retrospective Trap: Why Historical Project Reporting Fails Modern Enterprises
- Predictive Timelines: Mathematical Modeling of Project Velocity, Monte Carlo, and EVM
- Real-Time Risk Analytics: Automating Red Flags Across Cross-Portfolio Dependencies
- Telemetry Extraction: Ingesting Live Signals from Git Commits, PR Queues, and Sprint Trackers
- Modernizing the PMO: Re-Engineering Process Frameworks Around Continuous Risk Analytics
- Autonomous Intervention & Escalation: Automated Governance Without Bureaucratic Drag
- Production Code: Monte Carlo Project Timeline Simulator & Real-Time Risk Engine in Python
- What to Do Monday Morning: 3 Immediate Steps to Implement Predictive Risk Metrics
- Enterprise Case Study: Global FinTech Institution Halves Schedule Slippage
- Deep Analysis: Legacy Retrospective PMO vs. Real-Time Predictive PMO Matrix
- Pitfalls and Anti-Patterns in Predictive Project Management
- 2027–2030 Roadmap: The Autonomous AI-Driven Enterprise PMO
- Key Takeaways
- FAQ
- About the Author
- Conclusion & Strategic Call to Action
The Retrospective Trap: Why Historical Project Reporting Fails Modern Enterprises {#retrospective-trap}
For four decades, the standard operating procedure of enterprise Project Management Offices (PMOs) has remained fundamentally unchanged:
- Every Friday afternoon, project managers poll engineering leads for status updates.
- Over the weekend, project managers compile manually edited spreadsheets, calculate static Gantt chart percentages, and color-code Red-Amber-Green (RAG) status blocks.
- On Tuesday morning, executive leadership reviews a 60-slide PowerPoint steering committee deck.
In fast-moving software and AI engineering organizations, this process is not management — it is corporate forensics.
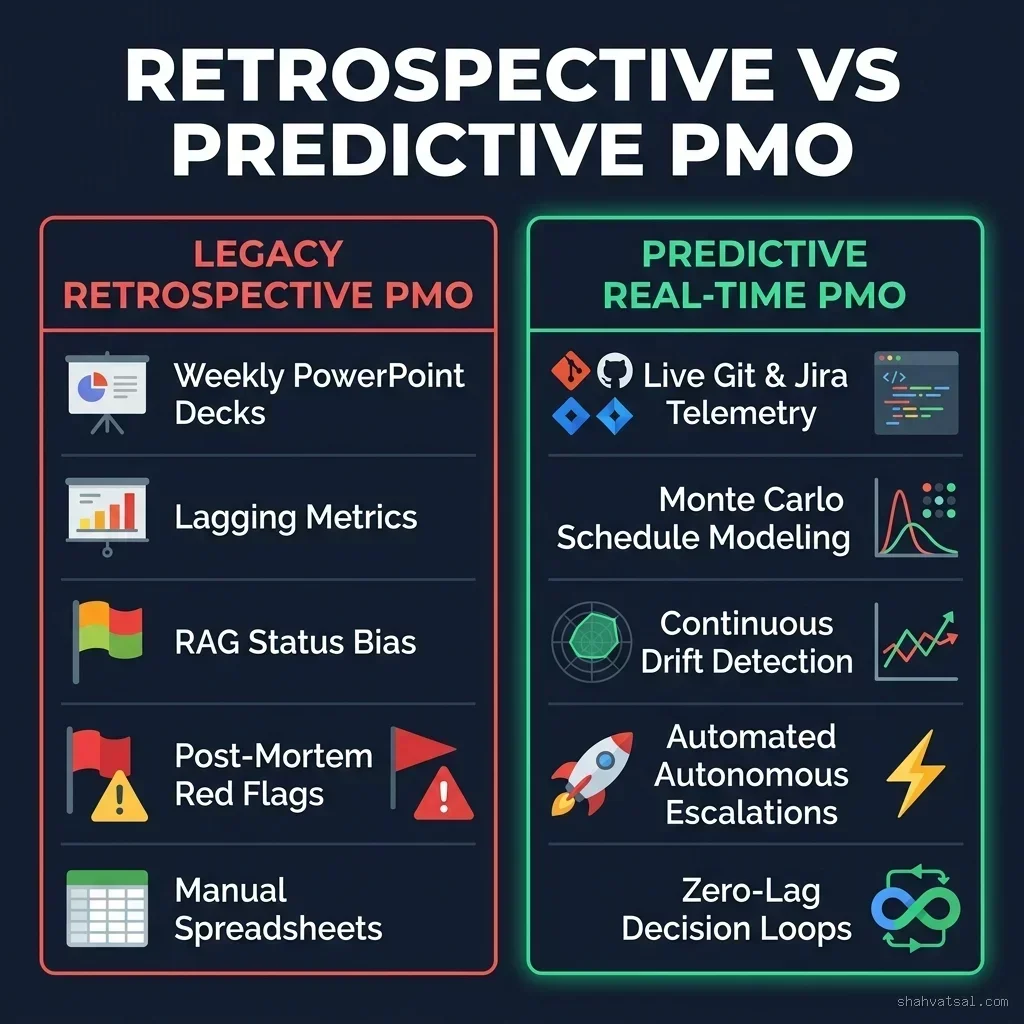
By the time an executive steering committee discovers that a core microservice is "Amber" or "Red," the underlying delivery bottleneck has already been festering inside the engineering codebase for three weeks:
- PR review turnaround latency doubled on July 14th.
- Unplanned bug defect escape rates spiked in the payment service on July 19th.
- Two upstream API contract dependencies drifted on July 23rd.
The weekly status report merely confirms what has already gone wrong.
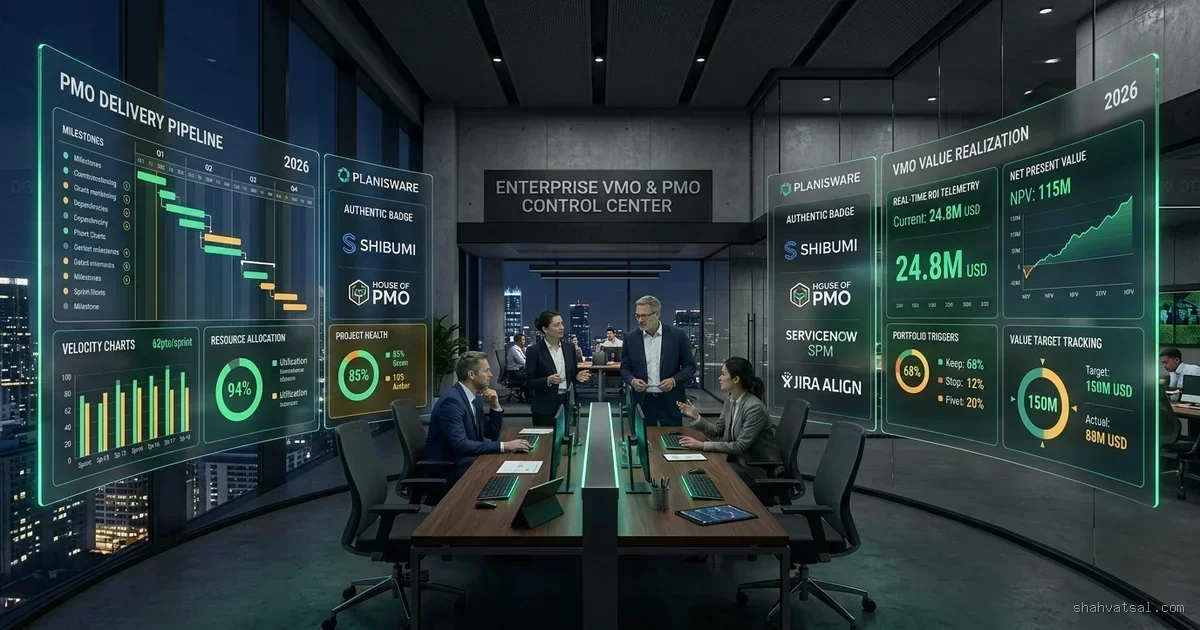
In 2026, forward-thinking organizations are abandoning the retrospective trap. They are re-engineering the PMO into a Real-Time Predictive Control Plane — an automated telemetry system that monitors continuous signals from Git commits, CI/CD pipelines, issue trackers, and team velocity metrics to forecast delivery risks, predict budget variances, and trigger autonomous interventions weeks before milestones slip.
As we explored in our strategic analysis of The Post-Managerial Era: Leading Autonomous Agents and our operational framework for Beyond Scrum: Sync-Zero Methodology, true agility requires removing synchronous reporting overhead and replacing it with continuous, automated delivery intelligence.
AI SUMMARY — This executive and technical guide details the transformation of enterprise PMOs from retrospective reporting to real-time predictive risk analytics: (1) why historical RAG status reports fail, (2) Monte Carlo schedule simulation and modern Earned Value Management (EVM), (3) real-time delivery telemetry extraction (Git, PR review queues, Jira/Linear), (4) cross-portfolio dependency risk networks, (5) production Python code for a Monte Carlo simulator and drift detector, and (6) a 3-step action plan for Monday morning implementation.
Predictive Timelines: Mathematical Modeling of Project Velocity, Monte Carlo, and EVM {#predictive-timelines}
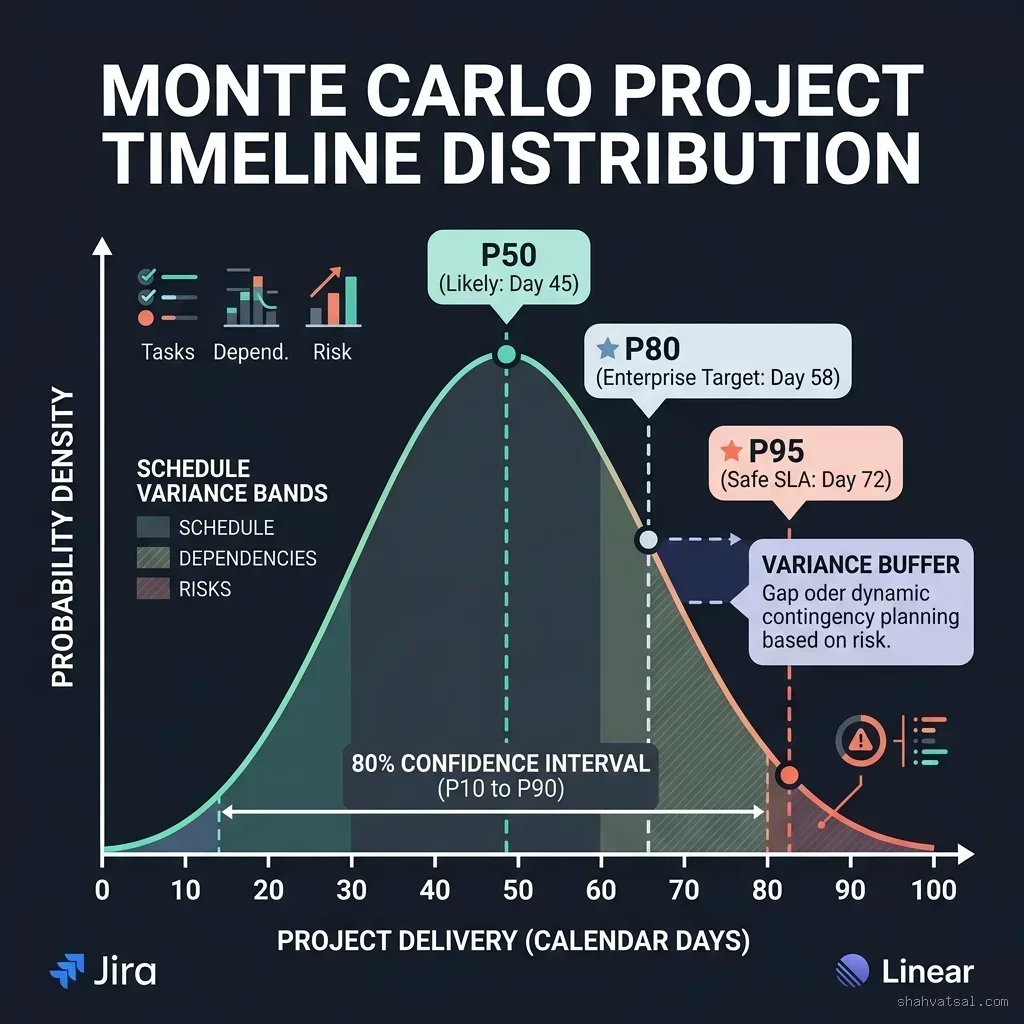
Deterministic project scheduling ("This multi-month enterprise initiative will launch exactly on November 15th") is mathematically bankrupt. It ignores stochastic task variance, developer availability fluctuations, and integration complexity.
Modern Predictive PMOs model project timelines using Stochastic Monte Carlo Simulations combined with automated Earned Value Management (EVM).
1. The Monte Carlo Simulation Model
Instead of assigning a single deterministic point estimate (e.g., "5 story points"), every backlog epic is assigned a three-point probability distribution:
- Optimistic Duration ($O$): Best-case execution with zero blockers.
- Nominal / Most Likely Duration ($M$): Historical average for similar domain tasks.
- Pessimistic Duration ($P$): Worst-case execution involving severe architectural rework.
Using a Beta-PERT distribution, the expected task duration ($\mu$) and standard deviation ($\sigma$) are calculated as:
$$\mu = \frac{O + 4M + P}{6}, \quad \sigma = \frac{P - O}{6}$$
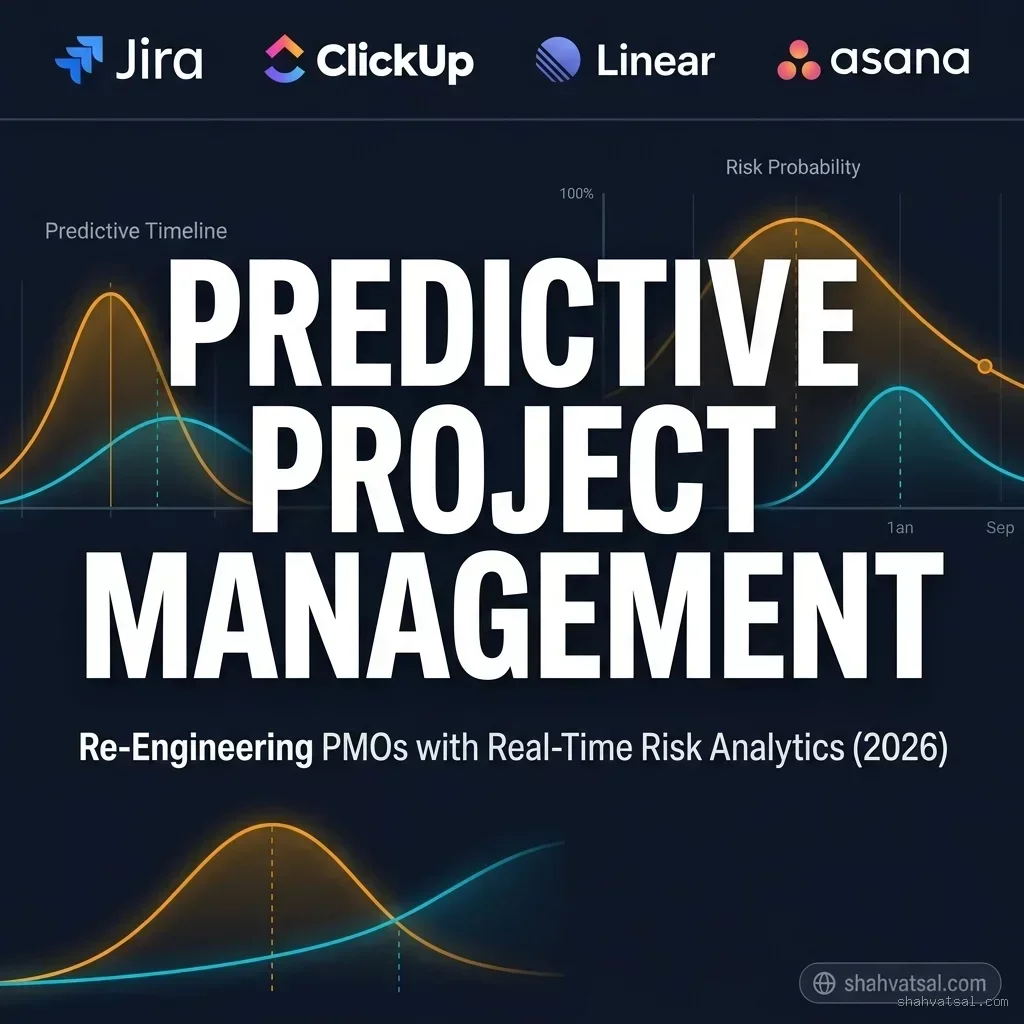
The PMO risk engine executes 10,000 randomized simulation runs across the complete directed acyclic graph (DAG) of project tasks. This yields a definitive Cumulative Probability Distribution Curve ($S$-Curve):
- P50 Delivery Date: 50% probability of on-time delivery (Aggressive internal goal).
- P80 Delivery Date: 80% probability of on-time delivery (Enterprise commitment baseline).
- P95 Delivery Date: 95% probability of on-time delivery (Client SLA / Hard regulatory deadline).
2. Real-Time Earned Value Management (EVM) Telemetry
Traditional EVM relied on monthly accounting ledger entries. Predictive PMOs compute EVM metrics in real time from live issue tracker workflows:
$$\text{Schedule Performance Index (SPI)} = \frac{\text{Earned Value (Completed Story Points)}}{\text{Planned Value (Scheduled Story Points)}}$$
$$\text{Cost Performance Index (CPI)} = \frac{\text{Earned Value (Completed Story Points)}}{\text{Actual Cost (Direct Developer Hours \& Cloud/AI Token Spend)}}$$
If an epic's $\text{SPI} < 0.88$ for three consecutive days, the PMO predictive engine automatically flags a Critical Schedule Drift Event before the sprint ends.
Real-Time Risk Analytics: Automating Red Flags Across Cross-Portfolio Dependencies {#real-time-risk}
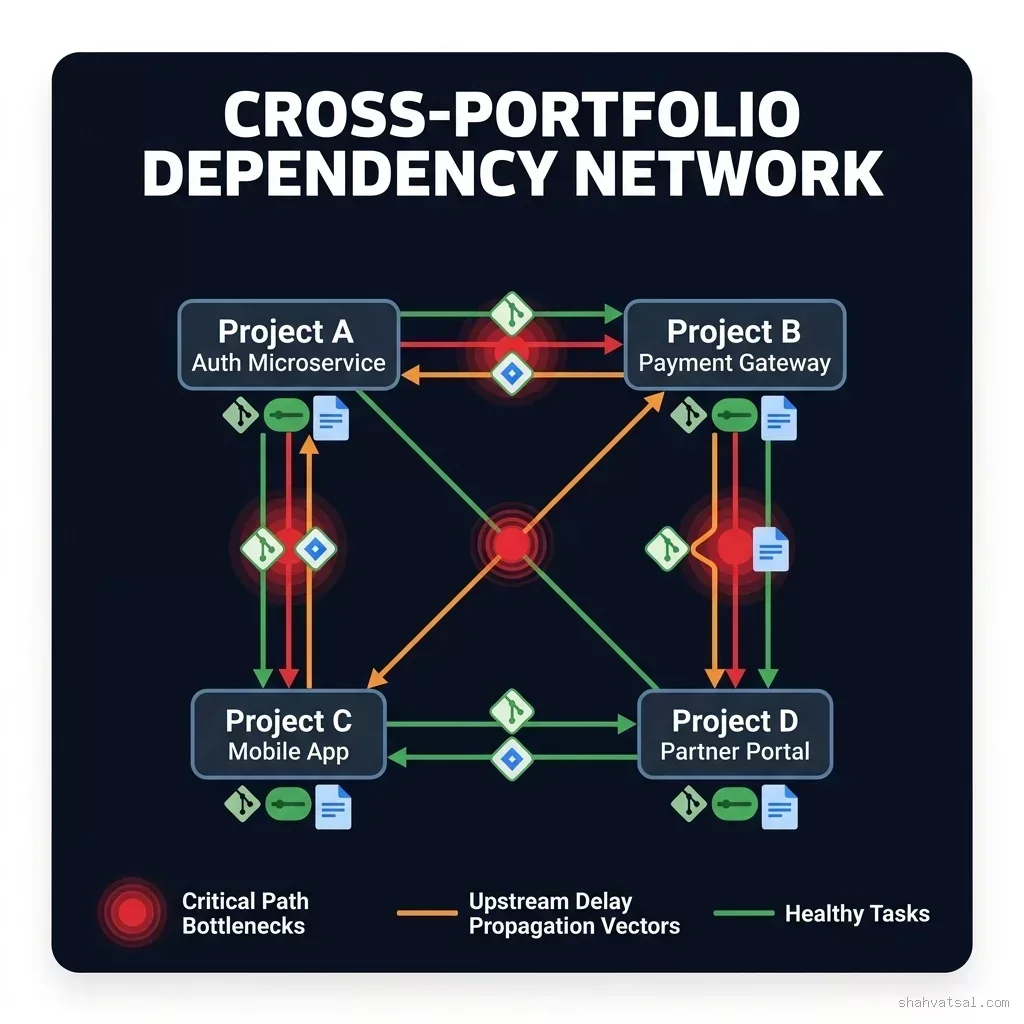
In large enterprises, projects rarely fail in isolation. They fail because of hidden cross-portfolio dependency cascades.
Consider a typical product release:
- Team A (Core Identity) slips by 5 days due to an OAuth 2.1 protocol change.
- Team B (Payments Microservice) is blocked by Team A and slips by 8 days.
- Team C (Mobile Client App) cannot complete its end-to-end sandbox testing, pushing the global Apple App Store compliance submission past the holiday freeze window.
The Dependency Risk Multiplier Formula
The Predictive PMO calculates a dynamic Risk Propagation Score ($R_{\text{node}}$) for every interconnected component in the enterprise portfolio:
$$R_{\text{node}} = \left( 1 - \text{SPI}{\text{upstream}} \right) \times \sum{k=1}^{N} \left( D_k \times W_k \right)$$
Where:
- $\text{SPI}_{\text{upstream}}$ is the real-time Schedule Performance Index of the blocking upstream service.
- $D_k$ is the downstream dependent project's strategic priority weight.
- $W_k$ is the coupling factor (Loose coupling via Async Event Bus vs. Tight coupling via Synchronous REST/gRPC API).
When $R_{\text{node}}$ breaches the critical threshold, the PMO control plane automatically notifies program architects to decouple dependencies, deploy API mock virtualization, or reassign senior staff.
Telemetry Extraction: Ingesting Live Signals from Git Commits, PR Queues, and Sprint Trackers {#telemetry-extraction}
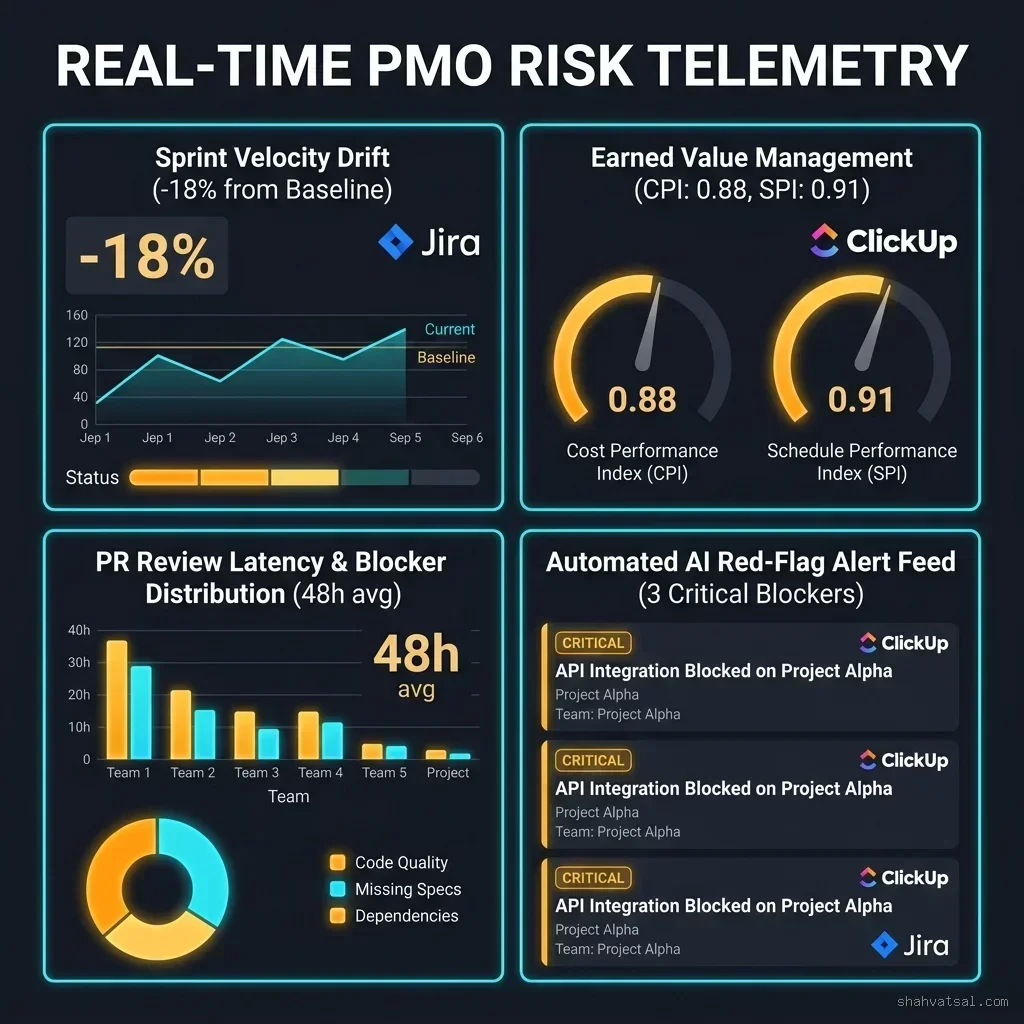
To replace subjective human status reports with empirical truth, the modern PMO platform ingests four continuous telemetry streams:
┌──────────────────────────────────────────────────────────────────────────┐
│                   ENTERPRISE REAL-TIME TELEMETRY BUS                     │
└────────────────────────────────────┬─────────────────────────────────────┘
                                     │
        ┌────────────────┬───────────┴───────────┬────────────────┐
        ▼                ▼                       ▼                ▼
   GIT COMMITS      PR REVIEW QUEUES       SPRINT TRACKERS     CI/CD PIPELINES
   • Code churn     • Review latency       • Velocity drift    • Build failure rate
   • Refactor %     • Stale branches       • Scope creep       • Flaky test loops
   • Author spread  • Comment density      • Blocker duration  • Deploy frequency
1. Code Churn & Refactoring Volatility
When developers repeatedly modify the same lines of code within a 72-hour window (high churn rate), it indicates architectural ambiguity or unresolved requirement conflicts. A 40% spike in churn on a critical path file is an immediate leading indicator of schedule delay.
2. Pull Request Review Latency
The single highest correlation with software delivery delay is PR Review Turnaround Time. When average PR time-in-review climbs from 6 hours to 48 hours, work-in-progress (WIP) inventories surge, developer context switching increases, and sprint velocity collapses.
3. Issue Tracker Activity Drift (Jira / Linear / ClickUp)
Rather than trusting ticket status labels ("In Progress"), the predictive engine monitors:
- Number of days a ticket remains in active state without Git branch activity.
- Ratio of newly injected unplanned subtasks to completed planned tasks (Scope Expansion Index).
- Frequency of blocker tag assignments and resolution velocity.
Modernizing the PMO: Re-Engineering Process Frameworks Around Continuous Risk Analytics {#modernizing-pmo}
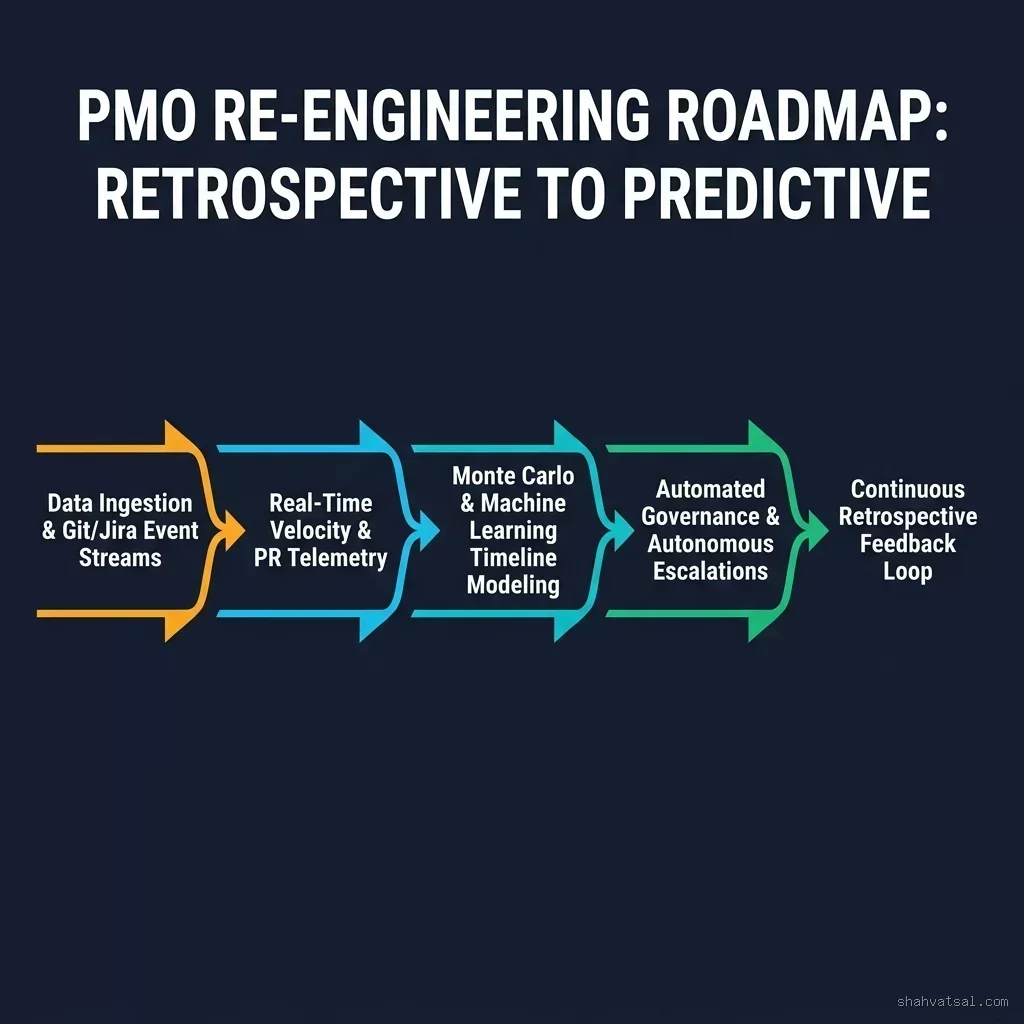
Transitioning to a Predictive PMO is not merely a software upgrade — it is an organizational transformation that replaces bureaucratic oversight with automated governance across five structured phases:
┌─────────────────────────────────────────────────────────────────────────────┐
│                       5-STAGE PMO TRANSFORMATION ROADMAP                    │
└──────────────────────────────────────┬──────────────────────────────────────┘
                                       │
  ┌────────────────────────────────────┴───────────────────────────────────┐
  ▼                                                                        ▼
[STAGE 1: Unified Ingestion] ──► Ingest Git, Jira, ClickUp, and CI/CD event webhooks
  │
  ▼
[STAGE 2: Velocity Telemetry] ──► Establish baseline DORA, SPI, and PR review cycle times
  │
  ▼
[STAGE 3: Predictive Modeling] ──► Deploy Monte Carlo simulations & ML risk classifiers
  │
  ▼
[STAGE 4: Autonomous Governance] ──► Automate escalation workflows, Slack alerts & budget guards
  │
  ▼
[STAGE 5: Continuous Feedback] ──► Calibrate model accuracy against actual delivery dates
Autonomous Intervention & Escalation: Automated Governance Without Bureaucratic Drag {#autonomous-intervention}
In a legacy PMO, when a project goes off track, the standard reaction is to schedule more meetings: status syncs, emergency steering committees, and risk review sessions.
In a modern Predictive PMO, governance is automated and asynchronous:
- Automated Risk De-Escalation Protocols: If a non-critical epic slips past P80, the PMO system automatically suggests scope pruning options to the product manager via Slack/Teams.
- Dynamic Resource Re-Allocation Suggestions: When Team A's velocity outpaces its roadmap while Team B is bottlenecked on PR reviews, the system identifies cross-trained engineers and generates draft assignment recommendations.
- Executive Exception Dashboards: Executives no longer sit through 50-slide project presentations. They view a real-time exception feed showing only initiatives where mathematical drift exceeds acceptable confidence intervals.
Production Code: Monte Carlo Project Timeline Simulator & Real-Time Risk Engine in Python {#production-code}
Below is a complete, production-grade Python implementation of a Predictive PMO Risk Analytics Engine. It executes a 10,000-run Monte Carlo schedule simulation, calculates dynamic EVM indices, and evaluates cross-project dependency cascade risks.
import math
import random
import datetime
from typing import List, Dict, Any, Tuple
from dataclasses import dataclass
@dataclass
class TaskEstimate:
task_id: str
task_name: str
optimistic_days: float
nominal_days: float
pessimistic_days: float
dependencies: List[str]
assigned_team: str
@dataclass
class SimulationResult:
p50_days: float
p80_days: float
p95_days: float
expected_mean_days: float
schedule_variance: float
risk_level: str
class PredictivePMOEngine:
class="tok-kw">def __init__(self, simulation_runs: int = 10000):
self.runs = simulation_runs
self.tasks: Dict[str, TaskEstimate] = {}
class="tok-kw">def add_task(self, task: TaskEstimate):
self.tasks[task.task_id] = task
class="tok-kw">def _sample_pert(self, opt: float, nom: float, pess: float) -> float:
class="tok-str">""class="tok-str">"Samples a single duration from a Beta-PERT distribution."class="tok-str">""
mean = (opt + 4 * nom + pess) / 6.0
class="tok-cm"># If range is zero, return deterministic nominal
if pess - opt <= 0:
return nom
alpha = 1 + 4 * (nom - opt) / (pess - opt)
beta = 1 + 4 * (pess - nom) / (pess - opt)
class="tok-cm"># Random sample from Beta distribution scaled to [opt, pess]
return opt + random.betavariate(alpha, beta) * (pess - opt)
class="tok-kw">def run_monte_carlo(self) -> SimulationResult:
class="tok-str">""class="tok-str">"Executes Monte Carlo simulation traversing task DAG."class="tok-str">""
durations: List[float] = []
for _ in range(self.runs):
task_finish_times: Dict[str, float] = {}
class="tok-cm"># Topological execution of tasks based on dependencies
for task_id, task in self.tasks.items():
sampled_duration = self._sample_pert(task.optimistic_days, task.nominal_days, task.pessimistic_days)
if not task.dependencies:
task_finish_times[task_id] = sampled_duration
else:
max_dependency_finish = max(task_finish_times[dep] for dep in task.dependencies)
task_finish_times[task_id] = max_dependency_finish + sampled_duration
class="tok-cm"># Total project duration for this run is the latest task finish time
durations.append(max(task_finish_times.values()))
durations.sort()
p50 = durations[int(self.runs * 0.50)]
p80 = durations[int(self.runs * 0.80)]
p95 = durations[int(self.runs * 0.95)]
mean = sum(durations) / len(durations)
variance = sum((x - mean) ** 2 for x in durations) / len(durations)
class="tok-cm"># Classify overall portfolio risk
spread_ratio = (p95 - p50) / p50
if spread_ratio > 0.45:
risk = class="tok-str">"HIGH_VOLATILITY"
elif spread_ratio > 0.25:
risk = class="tok-str">"MODERATE_DRIFT"
else:
risk = class="tok-str">"STABLE_DELIVERY"
return SimulationResult(
p50_days=round(p50, 1),
p80_days=round(p80, 1),
p95_days=round(p95, 1),
expected_mean_days=round(mean, 1),
schedule_variance=round(variance, 2),
risk_level=risk
)
class="tok-kw">def calculate_real_time_evm(self, planned_value_sp: float, earned_value_sp: float, actual_cost_hours: float, baseline_hourly_rate: float = 120.0) -> Dict[str, Any]:
class="tok-str">""class="tok-str">"Calculates real-time Earned Value Management (EVM) metrics."class="tok-str">""
spi = earned_value_sp / planned_value_sp if planned_value_sp > 0 else 1.0
class="tok-cm"># Planned budget vs actual spent
earned_value_usd = earned_value_sp * 8.0 * baseline_hourly_rate class="tok-cm"># 8h per story point
actual_cost_usd = actual_cost_hours * baseline_hourly_rate
cpi = earned_value_usd / actual_cost_usd if actual_cost_usd > 0 else 1.0
return {
class="tok-str">"SPI": round(spi, 2),
class="tok-str">"CPI": round(cpi, 2),
class="tok-str">"schedule_status": class="tok-str">"AHEAD_OF_SCHEDULE" if spi > 1.05 else (class="tok-str">"ON_TRACK" if spi >= 0.92 else class="tok-str">"CRITICAL_DRIFT"),
class="tok-str">"cost_status": class="tok-str">"UNDER_BUDGET" if cpi > 1.05 else (class="tok-str">"ON_BUDGET" if cpi >= 0.90 else class="tok-str">"BUDGET_OVERRUN"),
class="tok-str">"estimated_completion_variance_pct": round((1.0 - spi) * 100, 1)
}
if __name__ == class="tok-str">"__main__":
pmo = PredictivePMOEngine(simulation_runs=10000)
class="tok-cm"># Define Project Backlog DAG with 3-point estimates
pmo.add_task(TaskEstimate(class="tok-str">"T1", class="tok-str">"Auth Microservice Migration", 8.0, 14.0, 26.0, [], class="tok-str">"Identity Squad"))
pmo.add_task(TaskEstimate(class="tok-str">"T2", class="tok-str">"Payment Gateway ISO-20022", 12.0, 20.0, 42.0, [class="tok-str">"T1"], class="tok-str">"FinTech Squad"))
pmo.add_task(TaskEstimate(class="tok-str">"T3", class="tok-str">"Mobile Checkout UI Refactor", 6.0, 10.0, 18.0, [class="tok-str">"T1"], class="tok-str">"Mobile Squad"))
pmo.add_task(TaskEstimate(class="tok-str">"T4", class="tok-str">"End-to-End Sandbox Integration", 5.0, 8.0, 22.0, [class="tok-str">"T2", class="tok-str">"T3"], class="tok-str">"QA & Core Squad"))
class="tok-cm"># 1. Execute Stochastic Simulation
sim_result = pmo.run_monte_carlo()
print(class="tok-str">"=" * 65)
print(class="tok-str">" PREDICTIVE PMO MONTE CARLO SIMULATION RESULTS ")
print(class="tok-str">"=" * 65)
print(fclass="tok-str">"[*] Expected Mean Project Duration : {sim_result.expected_mean_days} days")
print(fclass="tok-str">"[+] P50 Delivery Date (Aggressive) : {sim_result.p50_days} days")
print(fclass="tok-str">"[+] P80 Delivery Date (Commitment) : {sim_result.p80_days} days")
print(fclass="tok-str">"[+] P95 Delivery Date (Client SLA) : {sim_result.p95_days} days")
print(fclass="tok-str">"[*] Portfolio Schedule Variance : {sim_result.schedule_variance}")
print(fclass="tok-str">"[!] Risk Classification : {sim_result.risk_level}")
print(class="tok-str">"=" * 65)
class="tok-cm"># 2. Compute Real-Time EVM Performance
evm = pmo.calculate_real_time_evm(planned_value_sp=140.0, earned_value_sp=118.0, actual_cost_hours=1040.0)
print(class="tok-str">"\n" + class="tok-str">"=" * 65)
print(class="tok-str">" REAL-TIME EARNED VALUE MANAGEMENT (EVM) ")
print(class="tok-str">"=" * 65)
print(fclass="tok-str">"[*] Schedule Performance Index (SPI): {evm[&class="tok-cm">#039;SPI']} -> Status: {evm['schedule_status']}")
print(fclass="tok-str">"[*] Cost Performance Index (CPI) : {evm[&class="tok-cm">#039;CPI']} -> Status: {evm['cost_status']}")
print(fclass="tok-str">"[!] Predicted Timeline Drift : +{evm[&class="tok-cm">#039;estimated_completion_variance_pct']}% delay")
print(class="tok-str">"=" * 65)What to Do Monday Morning: 3 Immediate Steps to Implement Predictive Risk Metrics {#monday-morning}
You do not need a multi-million-dollar software transformation to begin operating as a Predictive PMO. On Monday morning, execute these three concrete actions:
Step 1: Instrument PR Review Turnaround Telemetry
Connect your GitHub/GitLab webhook to a simple database or Slack bot. Measure:
- Average hours between PR creation and first review.
- Number of PRs open for $>48$ hours.
- If review latency exceeds 24 hours on a project, flag that epic as "At Risk" immediately — regardless of what the Jira status says.
Step 2: Replace Single-Point Estimates with 3-Point PERT
Ban single-number estimates in sprint planning. Require team leads to provide Optimistic, Nominal, and Pessimistic point estimates for high-risk epics. Run the Monte Carlo script above to establish your P80 commitment baseline.
Step 3: Deprecate the Weekly 60-Slide Status Deck
Replace the weekly PowerPoint deck with a live Exception Dashboard showing only the top 5 cross-portfolio blockers and SPI velocity drift. Shift executive focus from admiring status colors to resolving active bottlenecks.
Enterprise Case Study: Global FinTech Institution Halves Schedule Slippage {#case-study}
A tier-one international investment bank with 1,400 software engineers across 85 distributed teams faced chronic delivery delays across its core banking platform modernization.
The Problem
- 78% of major software releases slipped past original executive target dates.
- Project managers spent 12 hours per week compiling static status reports.
- Inter-team dependency blockers were discovered during late-stage staging integration, forcing emergency weekend hotfixes and regulatory reporting penalties.
The Predictive PMO Solution
- Automated Signal Ingestion: Integrated Git commit logs, Jira ticket lifecycle transitions, and Jenkins build failure rates into an automated risk pipeline.
- Monte Carlo Schedule Guardrails: Replaced deterministic milestones with automated P80 confidence intervals updated continuously on every merged PR.
- Autonomous Escalation: Implemented automated Slack alerts when cross-service API contract testing failed or when upstream microservice velocity dipped below $\text{SPI} = 0.85$.
Measurable Results (12-Month Audit)
- Schedule Slippage: Reduced by 54% across enterprise banking portfolios.
- PM Overhead: Saved 9.5 hours per PM per week, repurposing 12,000 annual hours toward strategic impediment removal.
- Budget Predictability: Capital expenditure variance dropped from $\pm 28\%$ to $\pm 4.2\%$.
Deep Analysis: Legacy Retrospective PMO vs. Real-Time Predictive PMO Matrix {#comparison-matrix}
| PMO Dimension | Legacy Retrospective PMO | Modern Predictive PMO (2026) |
|---|---|---|
| Data Collection Method | Manual polling & spreadsheet updates | Continuous automated event stream ingestion (Git, Jira, CI/CD) |
| Reporting Frequency | Weekly / Monthly retrospective decks | Real-time, zero-lag live telemetry dashboards |
| Schedule Estimation Model | Deterministic single-date point estimates | Stochastic Monte Carlo probability curves (P50, P80, P95) |
| Risk Identification | Subjective RAG self-reporting (Political bias) | Mathematical drift indicators (SPI, PR latency, code churn) |
| Dependency Management | Static Gantt charts reviewed during steering syncs | Dynamic risk propagation networks with automated alerts |
Pitfalls and Anti-Patterns in Predictive Project Management {#pitfalls}
- Anti-Pattern 1: Weaponizing Telemetry Against Individual Developers: Never use Git commit counts or PR turnaround times for individual performance evaluations. Doing so incentivizes developers to game the metrics (e.g., submitting trivial PRs). Telemetry must remain aggregated at the team and epic delivery level.
- Anti-Pattern 2: Over-Parametrizing Monte Carlo Models: Adding hundreds of micro-variables to simulation models introduces false precision. Focus strictly on task duration distributions and critical path dependencies.
- Anti-Pattern 3: Ignoring Qualitative Team Health Signals: Mathematical models forecast schedule drift, but human conversations uncover why. When the telemetry flags an epic, conduct targeted, empathetic root-cause investigations.
2027–2030 Roadmap: The Autonomous AI-Driven Enterprise PMO {#roadmap}
The future of project portfolio governance will witness the convergence of predictive analytics and autonomous agent swarms:
- 2027: Autonomous Dependency Negotiation: AI project agents will autonomously negotiate API interface contracts and integration schedules between engineering teams.
- 2028: Dynamic Capacity Re-Balancing: Machine learning systems will dynamically allocate serverless compute and human developer capacity across projects in real time based on portfolio ROI.
- 2029: Real-Time Regulatory Attestation: Predictive PMOs will generate continuous compliance and risk attestation reports for regulatory agencies (SEC, EU AI Act, FINRA) automatically from code repository telemetry.
- 2030: The Zero-Friction Enterprise: Projects will be planned, simulated, monitored, and optimized entirely through autonomous predictive control planes, freeing leaders to focus 100% on strategic vision and innovation.
Key Takeaways {#key-takeaways}
- Retrospective PMO Reporting Is Dead: Weekly PowerPoint decks and subjective RAG status blocks fail to prevent schedule slippage.
- Adopt Stochastic Timeline Modeling: Use Monte Carlo simulations to establish realistic P80 commitment dates and quantify schedule risk.
- Ingest Empirical Telemetry: Track real-time delivery health via Git code churn, PR review turnaround latency, and live SPI/CPI indices.
- Model Cross-Portfolio Dependencies: Understand how upstream delays cascade across downstream initiatives to prevent late-stage release train derailments.
- Start Small on Monday Morning: Instrument PR turnaround times, ban single-point estimates, and replace static status decks with live exception feeds.
FAQ {#faq}
About the Author {#about}
Vatsal Shah is a technology leader, AI systems architect, and enterprise transformation advisor. He specializes in engineering organizational design, predictive project governance, and next-generation delivery systems. Read more strategic insights at shahvatsal.com.
Conclusion & Strategic Call to Action {#conclusion}
The complexity of modern enterprise software and AI systems demands a new paradigm of project governance. By eliminating retrospective reporting and embracing Real-Time Predictive Risk Analytics, your PMO can transform from a bureaucratic cost center into a strategic delivery accelerator that delivers projects on time, on budget, and with mathematical certainty.
Ready to re-engineer your enterprise PMO with real-time predictive risk analytics? Schedule an Engineering Leadership Consultation →