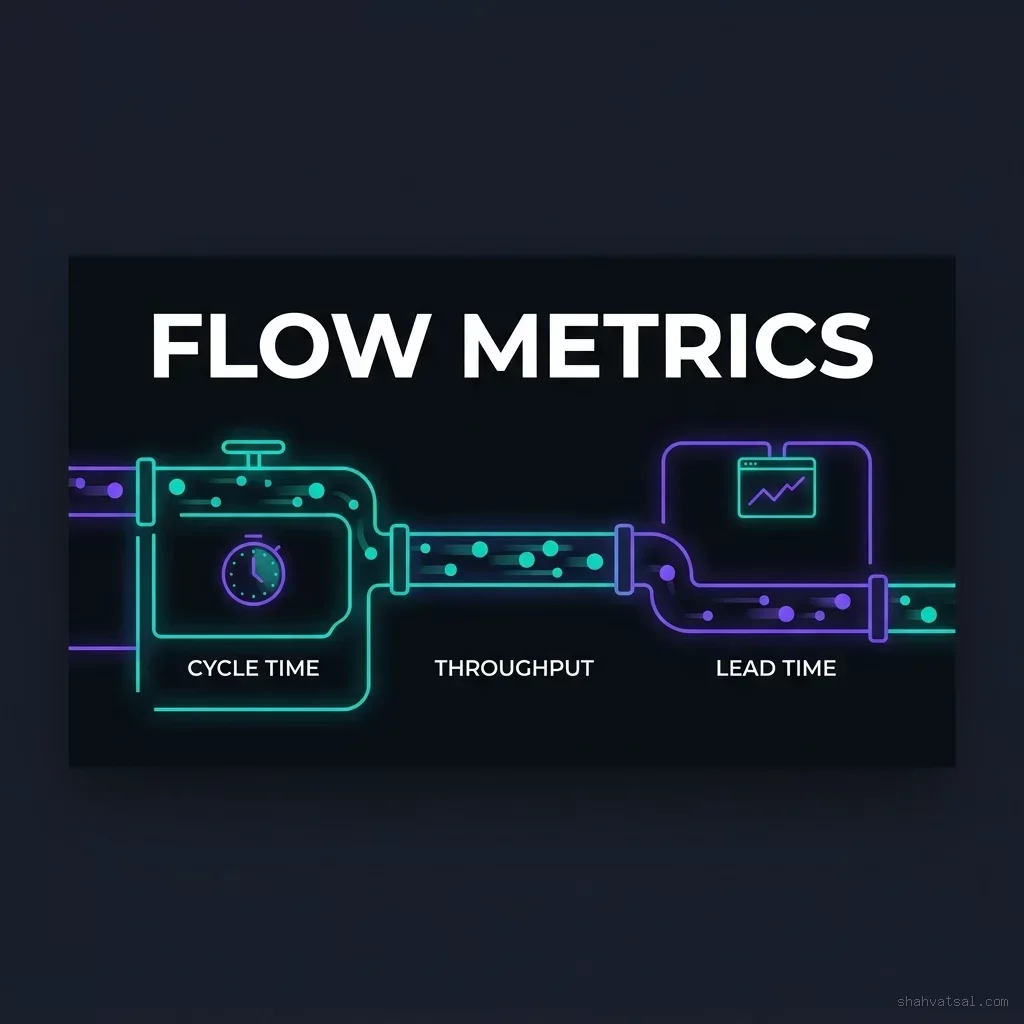
STRATEGIC OVERVIEW
The Death of the Commit: Why Volume Metrics Encourage AI Code Bloat There is a quiet crisis running through engineering organizations that have adopted AI coding tools at scale. The metrics dashboards are lighting up green. Commit frequency is up 300%.
The Death of the Commit: Why Volume Metrics Encourage AI Code Bloat
There is a quiet crisis running through engineering organizations that have adopted AI coding tools at scale. The metrics dashboards are lighting up green. Commit frequency is up 300%. Story point velocity has doubled. Lines of code delivered per sprint has shattered every historical benchmark. Engineering managers are celebrating. Yet the product is slower, buggier, and harder to maintain than it was eighteen months ago.
This is the AI productivity paradox. The tools that were supposed to make developers more effective have instead created a new class of technical debt disguised as throughput. And the reason this is happening is not because AI coding tools are poor. It is because the metrics organizations use to judge productivity were designed for an era when a human had to physically write every line of code.
Traditional engineering metrics operate on a foundational assumption: that effort and output are correlated. A developer who commits more frequently is assumed to be more productive. A team that closes more story points per sprint is assumed to be delivering more value. A codebase that grows in lines of code is assumed to be becoming more capable.
All three assumptions collapse when AI writes the majority of the code.
An AI coding assistant like GitHub Copilot, Cursor, or Google Antigravity can generate a complete feature implementation in under sixty seconds. That feature will appear in the commit history, add to the lines-of-code count, and close a story point ticket. But if the generated code introduces a subtle regression in an adjacent module, passes all automated tests by coincidence rather than correctness, and is architecturally inconsistent with the surrounding system, it has created negative value while recording positive metrics.
Engineering managers operating on commit-based dashboards will see the green numbers and approve the sprint as successful. Only in the next sprint, when support tickets begin arriving, will the actual outcome become visible. By then, the damage is done and the cost of remediation is three to five times higher than the cost of preventing the problem at the point of generation.
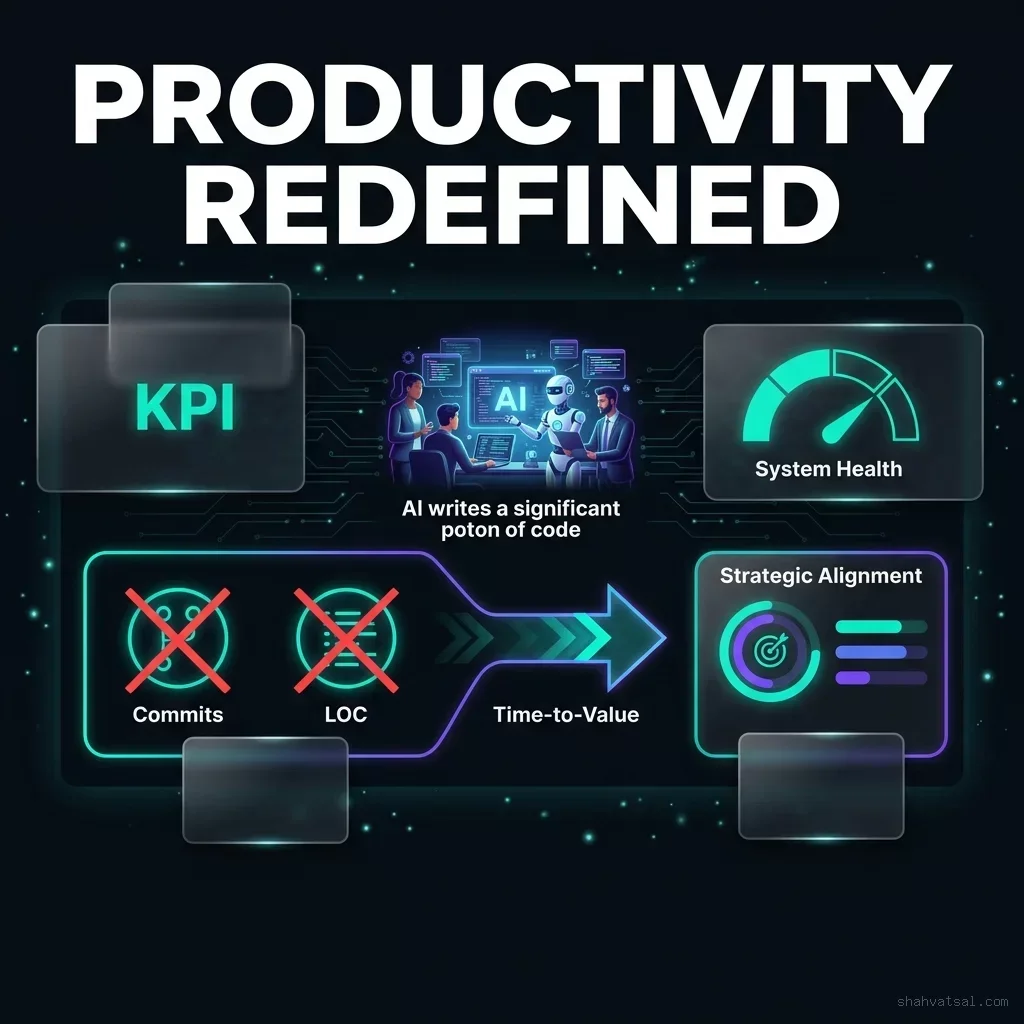
The Four Failures of Volume Metrics in AI-Native Teams
Understanding why legacy metrics fail requires examining each one individually.
Commit frequency was designed to measure developer engagement—the assumption being that a developer who commits more often is more engaged with the codebase and is making consistent forward progress. In an AI-assisted team, commit frequency simply reflects how often a developer accepts an AI suggestion and pushes it to version control. A single developer can triple their commit rate simply by accepting more Copilot completions without reading them carefully. The metric becomes a proxy for AI suggestion acceptance rate, not for developer judgment or value creation.
Lines of code (LOC) has always been a controversial metric, even before AI tools existed. Fred Brooks identified its fundamental flaw in The Mythical Man-Month in 1975: software value is inversely correlated with code volume because simpler code is inherently more maintainable, more secure, and more reliable. AI tools make this problem catastrophically worse. They are trained to generate complete, syntactically valid code blocks. When asked to implement a simple feature, they frequently produce verbose implementations because verbosity matches their training distribution better than concision. Teams that track LOC will systematically reward AI-generated bloat.
Story point velocity fails for a subtler reason. Story points are meant to measure relative complexity, not time. A team that uses AI tools to reduce the time required to implement complex tasks will find that their velocity increases dramatically—not because they are delivering more strategic value, but because AI has compressed the implementation timeline. The story points remain the same. The time decreases. Velocity goes up. But if the reduced implementation time came at the cost of reduced architectural thinking, the system becomes increasingly fragile at a rate that the velocity metric cannot detect.
Closed ticket count is perhaps the most dangerous metric in the AI era because it creates a strong perverse incentive. Developers who close the most tickets are rewarded by management. AI tools make it trivially easy to close tickets quickly by generating plausible-looking implementations. Without a compensating quality gate, teams will optimize for closing tickets at the expense of building systems that work correctly under production conditions.
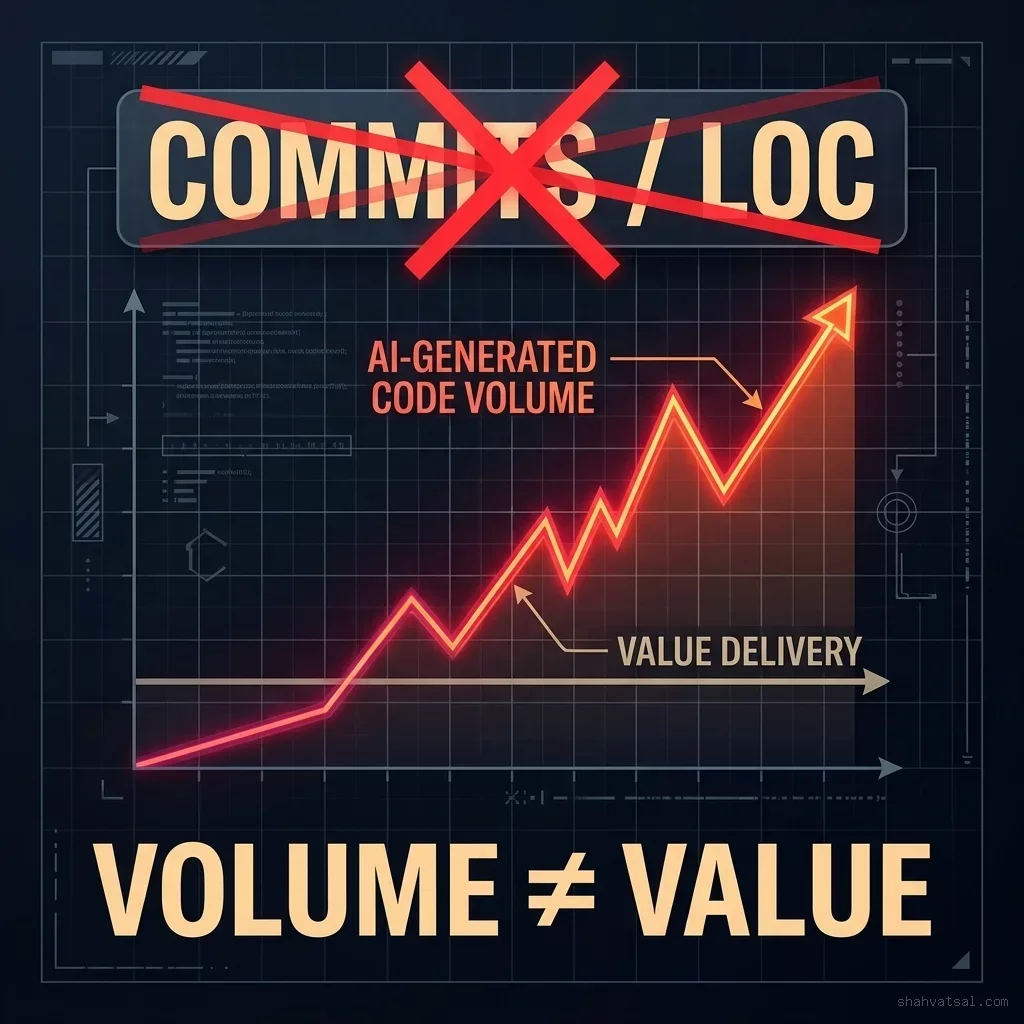
Metric 1: Time-to-Value (TTV) — Measuring Actual Feature Velocity
The first replacement metric for AI-native engineering teams is Time-to-Value (TTV). This metric measures the elapsed time from the moment a feature is formally specified to the moment it begins generating measurable value for end users in production.
TTV is fundamentally different from all volume metrics because it is anchored to business outcomes rather than engineering activity. It cannot be inflated by AI-generated code bloat because it measures the final destination—user value—not the journey.
Defining the TTV Measurement Points
A rigorous TTV implementation requires defining precise measurement boundaries. The clock starts at Feature Specification Lock — the moment the feature requirements are frozen and handed to engineering. It stops at Value Signal Confirmation — the moment telemetry confirms that real users are using the feature in production and generating value signals (purchases, sessions, API calls, or equivalent business events).
Between these two anchor points, TTV encompasses six phases:
- Architecture Review — The time spent designing the implementation approach, reviewing system dependencies, and identifying risk vectors.
- Implementation — The time spent writing, reviewing, and refining code (including AI-assisted generation and human verification).
- Testing — The time spent in automated test suites, integration testing, and QA validation.
- Deployment Pipeline — The time spent in CI/CD pipelines, staging verification, and production rollout.
- Monitoring & Stabilization — The time spent watching production metrics post-deploy, responding to edge-case failures, and confirming system stability.
- User Adoption Ramp — The time elapsed before the feature reaches meaningful adoption thresholds defined by the product team.
By capturing all six phases, TTV surfaces bottlenecks that volume metrics completely ignore. A team with extremely high commit velocity might have a terrible TTV because their deployment pipeline is slow, or because their features require extensive stabilization periods after release, or because users take weeks to adopt them due to poor UX design decisions made during rapid AI-assisted implementation.
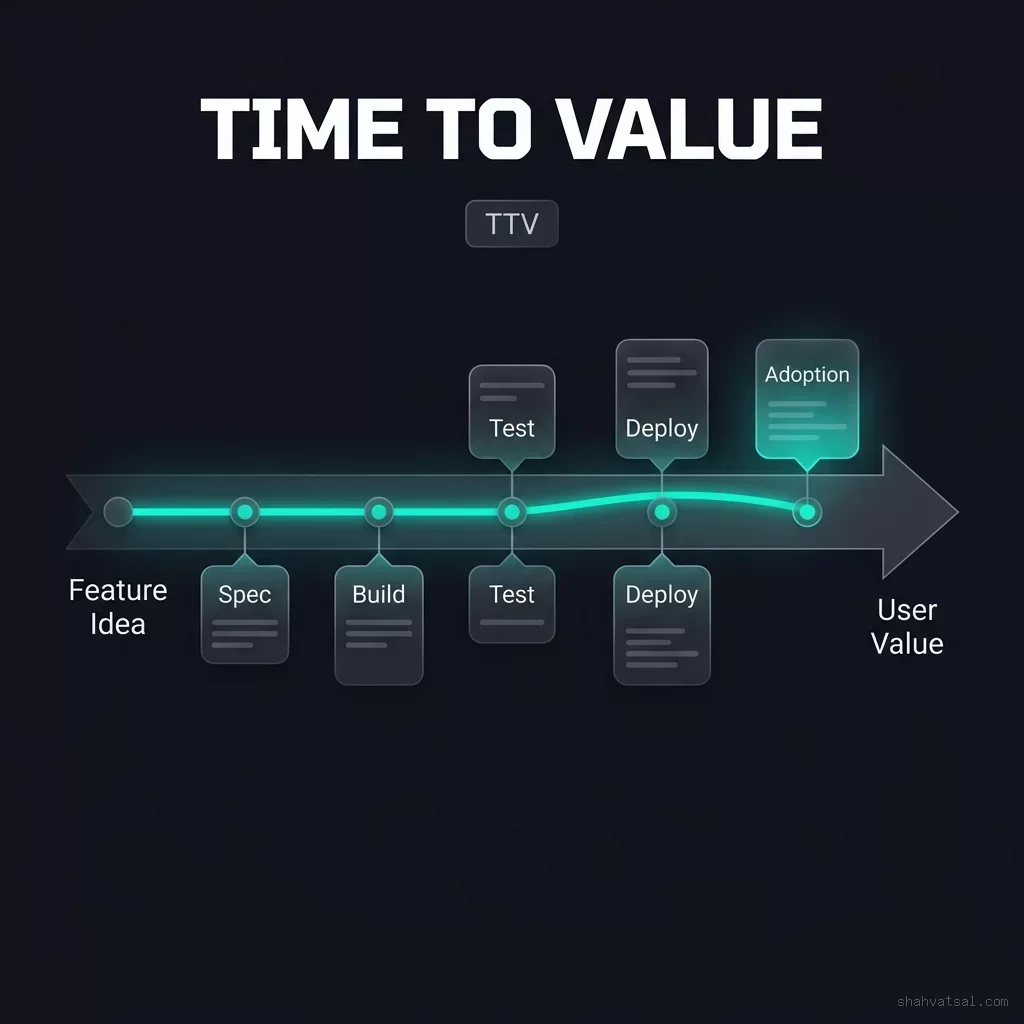
TTV as a Team Performance Indicator
When tracked consistently across sprints, TTV reveals patterns that volume metrics cannot. A team that consistently has long Architecture Review phases likely has a culture of implementing before thinking — a pattern that AI tools actively exacerbate. A team with long Monitoring & Stabilization phases likely has insufficient test coverage on AI-generated code. A team with long User Adoption Ramp phases likely has a misalignment between what engineering builds and what users actually need.
Each of these patterns maps to a specific intervention. Long Architecture Review times suggest investing in architectural documentation and AI prompt engineering that produces architecturally consistent code. Long Monitoring phases suggest investing in AI-specific regression detection and canary deployment tooling. Long Adoption Ramps suggest investing in user research and product discovery before the engineering sprint begins.
TTV does not tell engineering teams to work faster. It tells them where they are losing time and — more importantly — whether their speed of development is translating into speed of value delivery.
Metric 2: Code Quality and System Health — Quantifying AI Regression Rates
The second replacement metric addresses the most dangerous failure mode of AI-assisted development: the silent regression. AI coding tools are excellent at generating code that passes syntax checks and unit tests. They are poor at generating code that maintains the semantic integrity of a complex system over time.
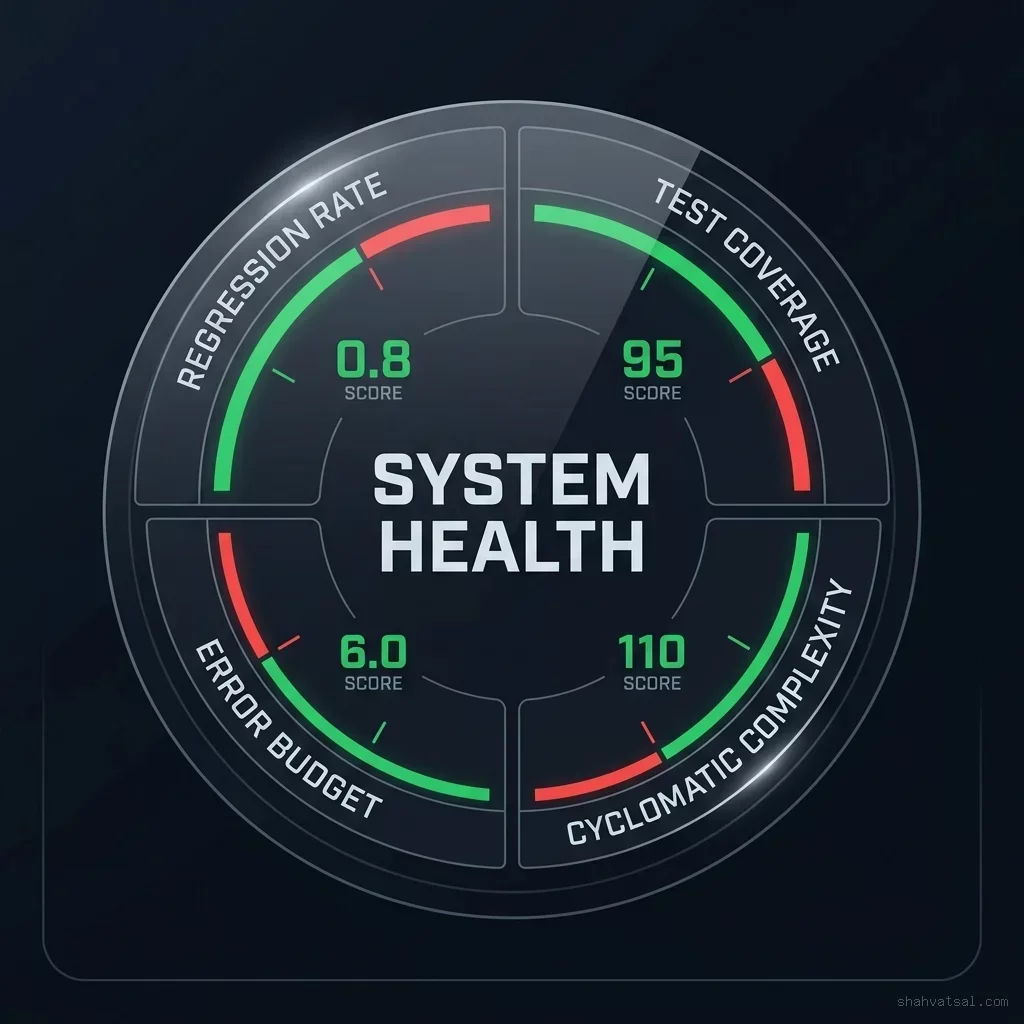
System Health is a composite metric that quantifies the long-term structural quality of an AI-assisted codebase across four dimensions.
Dimension 1: AI Regression Rate (ARR)
The AI Regression Rate measures the proportion of bugs introduced into production that can be traced back to AI-generated code blocks. This is calculated by tagging all AI-generated code at the point of creation (either through commit message conventions or AI attribution metadata) and then correlating production incidents with the source code regions involved.
$$\text{ARR} = \frac{\text{Production Incidents caused by AI-generated code}}{\text{Total Production Incidents}} \times 100$$
A healthy ARR for teams with mature AI validation pipelines sits between 15% and 30%. An ARR above 50% indicates that the team's AI validation gates are insufficient — that developers are accepting AI suggestions without adequate review. An ARR below 10% is achievable only with extremely rigorous human-in-the-loop validation practices or with very limited AI code generation.
Tracking ARR creates accountability for AI code quality that commit count and LOC cannot provide. A developer who closes ten tickets per sprint using AI tools but generates an ARR of 80% is actively degrading the system. A developer who closes three tickets per sprint but maintains an ARR of 10% is building durable, reliable software.
Dimension 2: Test Coverage Ratio on AI-Authored Modules
AI tools frequently generate implementation code without generating corresponding test coverage. When developers accept and commit AI implementations without writing tests, they accumulate test debt at an accelerated rate. System Health tracks the test coverage ratio specifically for modules where AI generation was used.
This creates a critical insight: if the test coverage ratio on AI-authored modules is significantly lower than the team average, it indicates a workflow gap where AI is being used for implementation but not for test generation. The intervention is straightforward — require AI tools to generate test suites alongside implementation code and make test coverage a gate in the code review process.
Dimension 3: Cyclomatic Complexity Score
Cyclomatic complexity measures the number of independent execution paths through a piece of code. High cyclomatic complexity correlates strongly with bug density, testing difficulty, and long-term maintenance cost. AI tools frequently generate high-complexity implementations because they optimize for feature completeness rather than simplicity.
Teams tracking System Health establish a complexity budget per sprint — a maximum allowable increase in average cyclomatic complexity per merged pull request. When the complexity budget is exceeded, the pull request is flagged for architectural review regardless of functional correctness.
Dimension 4: Error Budget Consumption Rate
For teams operating under SLO frameworks, error budget consumption rate is the ultimate measure of system health impact. Each production incident consumes error budget. AI-generated code that introduces regressions consumes error budget. The rate at which error budget is consumed — measured as a percentage of the monthly or quarterly budget — directly reflects the quality of AI-assisted development.
Implementing System Health Dashboards
System Health metrics require tooling investment. The most practical implementation path for most teams uses a combination of:
- Git blame attribution combined with AI commit tagging to generate ARR data from incident post-mortems.
- Coverage tooling (Istanbul for Node.js, Coverage.py for Python, JaCoCo for Java) with module-level breakdowns separated by AI-authored vs human-authored code.
- Static analysis tooling (SonarQube, CodeClimate, or Semgrep) integrated into CI/CD pipelines to enforce cyclomatic complexity limits per PR.
- SLO dashboards (Google Cloud SLOs, Datadog SLOs, or custom Prometheus/Grafana stacks) with error budget burn rate alerts.
The investment in this tooling pays for itself within two to three sprint cycles. Teams that implement System Health tracking consistently report that they identify and prevent AI-generated regressions at the PR review stage rather than discovering them in production — reducing the remediation cost by a factor of four to eight.
Metric 3: Strategic Alignment — Ensuring Dev Sprints Deliver Core Strategy
The third replacement metric addresses the highest-level failure mode of AI-assisted development: the ability to build extremely quickly in the wrong direction.
AI tools compress implementation time so dramatically that engineering teams can now complete in one sprint what previously required a full quarter. This acceleration is transformative when directed toward the right outcomes. It is catastrophically wasteful when directed toward technically impressive but strategically irrelevant work.
Strategic Alignment scoring measures whether the development work performed in each sprint maps to the company's core strategic objectives — and whether the distribution of engineering effort reflects the company's stated priorities.
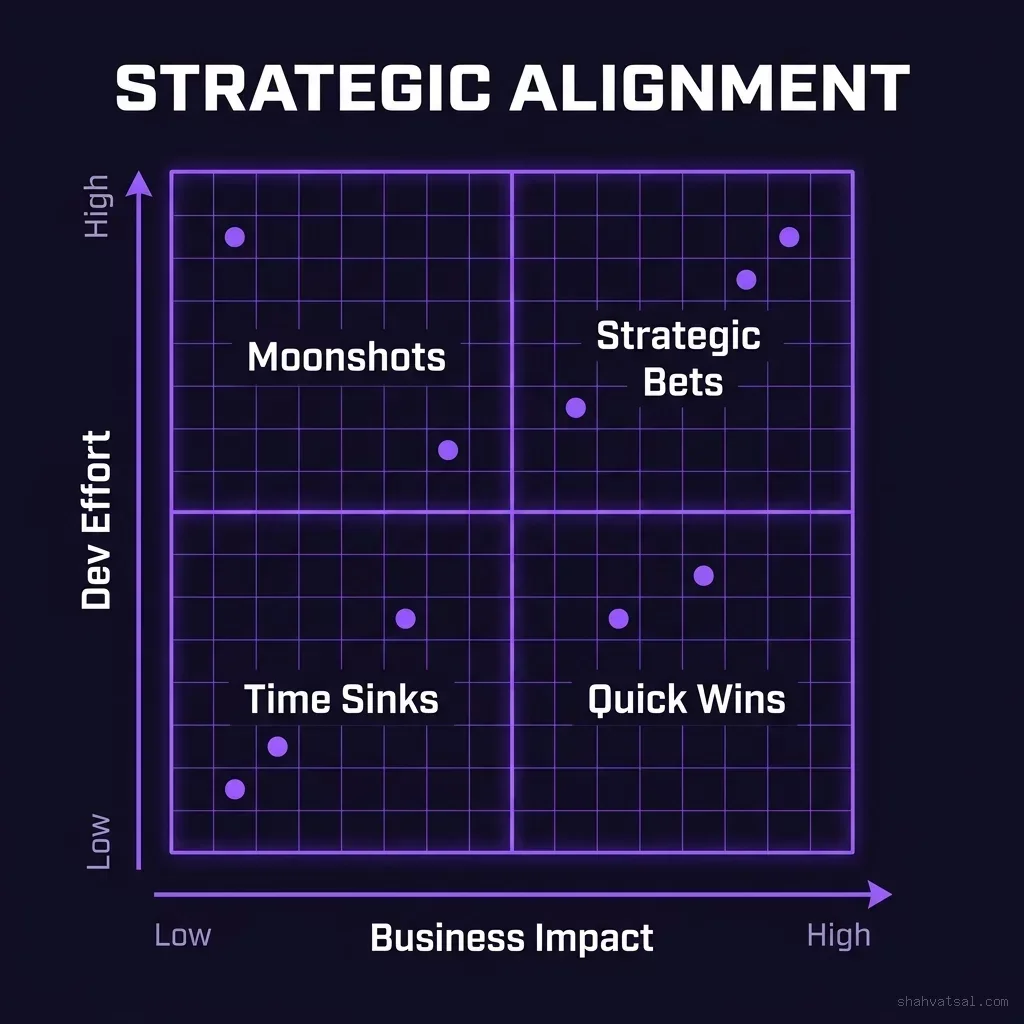
The Business Impact vs Dev Effort Quadrant
The foundation of Strategic Alignment scoring is a 2x2 quadrant model that maps every sprint ticket across two axes:
- Business Impact (X-axis): The expected measurable contribution to revenue, user retention, cost reduction, or competitive differentiation. Low = negligible business impact. High = directly moves a core business KPI.
- Dev Effort (Y-axis): The total engineering cost including implementation, testing, review, and deployment. Low = minimal engineering time. High = significant engineering investment.
This produces four quadrants:
- Quick Wins (Low Effort / High Impact): These are the highest-priority tickets — they deliver significant business value at low engineering cost. AI tools are ideally suited to Quick Wins because they can compress already-low implementation time even further.
- Strategic Bets (High Effort / High Impact): These are foundational investments that define competitive advantage. They require significant engineering expertise and should be protected from AI-generated shortcuts that reduce quality.
- Moonshots (High Effort / Low Impact): These are technically interesting but strategically questionable projects. Engineering teams frequently overinvest here because the problems are intellectually stimulating. Strategic Alignment scoring surfaces this misallocation.
- Time Sinks (Low Effort / Low Impact): These are the tickets that engineering teams complete because they are easy and feel productive, but contribute nothing meaningful. AI tools make Time Sinks extremely dangerous because they can be completed so rapidly that they fill sprint capacity before higher-impact work is scheduled.
Calculating the Strategic Alignment Score
The Strategic Alignment Score (SAS) for a sprint is calculated as the weighted proportion of sprint capacity invested in High-Impact quadrants:
$$\text{SAS} = \frac{\text{Story Points in Quick Wins + Strategic Bets}}{\text{Total Sprint Story Points}} \times 100$$
A healthy SAS sits above 70%. A SAS below 50% indicates that more than half of engineering capacity is being directed toward work with minimal business impact — a pattern that AI tools can dramatically accelerate into a full strategic misalignment crisis.
Strategic Alignment in Practice
Implementing Strategic Alignment scoring requires a one-time investment in ticket labeling. During sprint planning, each ticket is scored for Business Impact using a simple three-point scale defined by product leadership. Dev Effort is calculated using the existing story point estimation process.
Once scoring is established, the quadrant mapping takes less than ten minutes per sprint. The resulting SAS is reviewed in the sprint retrospective alongside TTV and System Health data, giving engineering leadership a complete picture of team performance across velocity, quality, and strategic direction.
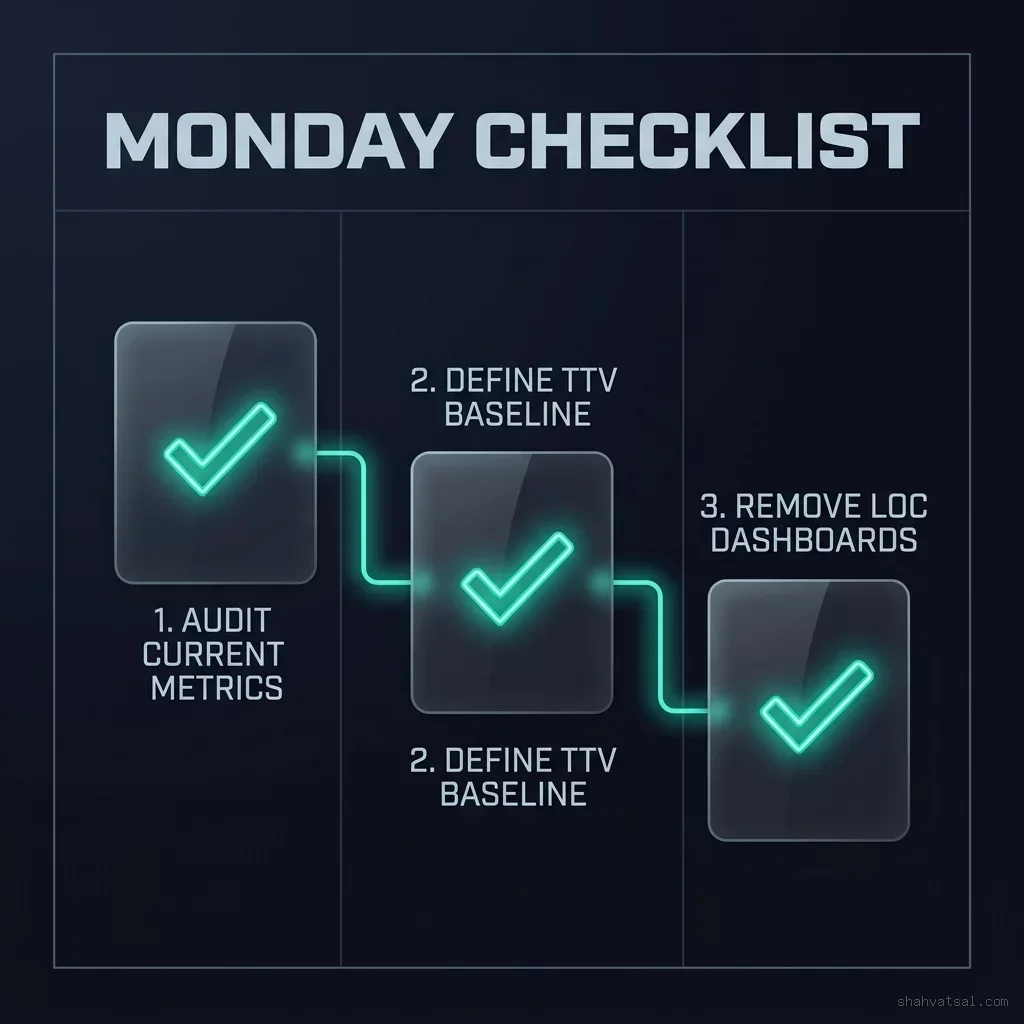
What to do Monday Morning: 3 Steps to Deprecate LOC Tracking in your PMO
Transitioning from legacy volume metrics to the TTV / System Health / Strategic Alignment framework does not require a complete overnight overhaul. The most effective approach is a phased deprecation that runs the new metrics in parallel with existing dashboards for one to two sprint cycles before removing legacy data sources.
Step 1: Audit Your Current Metrics and Their Decision Dependencies
Before removing any existing metric, map every management decision that currently relies on LOC, commit count, or story point velocity data. Common dependencies include:
- Performance reviews: Many engineering managers use commit frequency and story point velocity as inputs to quarterly performance evaluations. These must be replaced with TTV and System Health equivalents before legacy metrics can be removed.
- Sprint retrospective scoring: Teams that use velocity charts to judge sprint success will need alternative success criteria defined before velocity charts are retired.
- Budget justifications: Engineering budget requests that reference LOC-per-developer or velocity-per-headcount ratios will need to be reconstructed around TTV and business impact data.
This audit typically reveals three to five decision processes that need metric replacements. Document them explicitly. Each represents a commitment that must be honored before the corresponding legacy metric can be safely deprecated.
Step 2: Define TTV and System Health Baselines
Before the new metrics can replace old ones, you need baseline data to interpret them. Run TTV tracking for a minimum of two sprint cycles without making any changes to existing workflows. This establishes a baseline TTV for each feature category — bug fixes, new features, infrastructure improvements, and compliance work — that gives engineering leadership context for future readings.
Simultaneously, deploy System Health tooling in read-only mode. Configure coverage reporting, static analysis, and error budget dashboards to collect data without triggering any blocking gates. This allows teams to see the current state of AI regression rates and cyclomatic complexity without introducing friction that could distort baseline data.
At the end of the baseline period, present the combined TTV and System Health data to engineering leadership alongside the legacy metrics. In most organizations, this presentation is sufficient to generate organic support for metric deprecation — the legacy metrics will look obviously inadequate compared to the richer picture provided by the new framework.
Step 3: Remove LOC Dashboards and Commit-Based Reports in One Decisive Action
Phased removal of legacy dashboards creates organizational confusion. Once the new metrics are validated and baseline data is established, remove all LOC tracking, commit frequency reports, and velocity-as-success dashboards simultaneously.
Replace them with a unified Engineering Effectiveness Dashboard containing three panels:
- Feature TTV Trend — Rolling 8-sprint average of TTV by feature category.
- System Health Score — Weekly composite of ARR, coverage ratio, complexity trend, and error budget burn rate.
- Strategic Alignment Score — Per-sprint SAS with quadrant distribution breakdown.
This single dashboard gives engineering leadership, product management, and executive stakeholders a complete, accurate, and actionable view of engineering performance that volume metrics were never capable of providing.
The Organizational Culture Shift Behind Metric Replacement
Replacing metrics is not a technical problem. It is a cultural and organizational design problem. Developers who have spent years being evaluated on commit frequency and story point velocity will feel deeply uncomfortable with metrics they cannot directly control through output volume.
The most important cultural shift required for this transition is the move from activity accountability to outcome accountability. In an activity-accountability culture, a developer who works hard and produces a lot of output is valued regardless of whether that output moves business metrics. In an outcome-accountability culture, a developer who produces focused, strategic work that measurably improves TTV and System Health is valued regardless of their commit frequency.
This shift is particularly important when AI tools enter the team. AI tools make activity extremely cheap to produce. An outcome-accountability culture is resistant to AI code bloat because developers know that accepting AI suggestions that do not improve business outcomes will not advance their standing on the team.
The psychological safety required to make this shift must come from engineering leadership. Leaders who continue to celebrate high commit counts and velocity numbers — even informally — will undermine the metric transition regardless of what the official dashboards say. The metric change must be accompanied by explicit, repeated communication about what success looks like in the new framework.
Will these new metrics make our AI-assisted developers feel penalized?
Not if the transition is managed transparently. The key is involving developers in defining what good TTV and System Health numbers look like for their specific feature domains. Metrics designed with developer input create ownership rather than resistance.
How do we handle TTV for features that take multiple sprints to deliver?
Use rolling TTV measurements — calculate partial TTV at each sprint milestone (spec complete, implementation complete, testing complete) and track the cumulative total. This gives visibility into bottleneck phases even before the full feature reaches production.
Our PMO has LOC-based vendor contracts. How do we handle that?
Renegotiate vendor contracts to use delivered feature count and System Health scores as the basis for billing rather than LOC. Most technology vendors will agree to this if presented with a clearly defined alternative measurement framework.
Does Strategic Alignment scoring work in a startup with rapidly shifting priorities?
Yes, but recalculate Business Impact scores at the start of each sprint rather than quarterly. In high-change environments, the sprint-level quadrant mapping is the most current reflection of strategic priorities.
What happens to sprint planning when we remove story point velocity targets?
Replace velocity targets with TTV targets — commit to a maximum TTV for features entering the current sprint based on their category baseline. This creates accountability for delivery speed without rewarding activity volume.
About the Author
Vatsal Shah is an AI Solutions Architect and Engineering Leadership strategist. He works with CTO offices and PMO leadership teams to redesign engineering performance frameworks for the AI-native development era, replacing legacy volume metrics with outcome-based measurement systems built for organizations where AI writes the majority of code.