What happens to your IT Service Desk when 2,000 autonomous agents execute 50,000 tool calls an hour? Traditional ITIL ticket queues drown in under 48 hours. Discover why leading enterprises abandon human-centric incident ticketing in favor of Observability-First Ops: real-time telemetry circuit breakers, graph-native agent CMDBs, and automated policy-as-code guardrails.
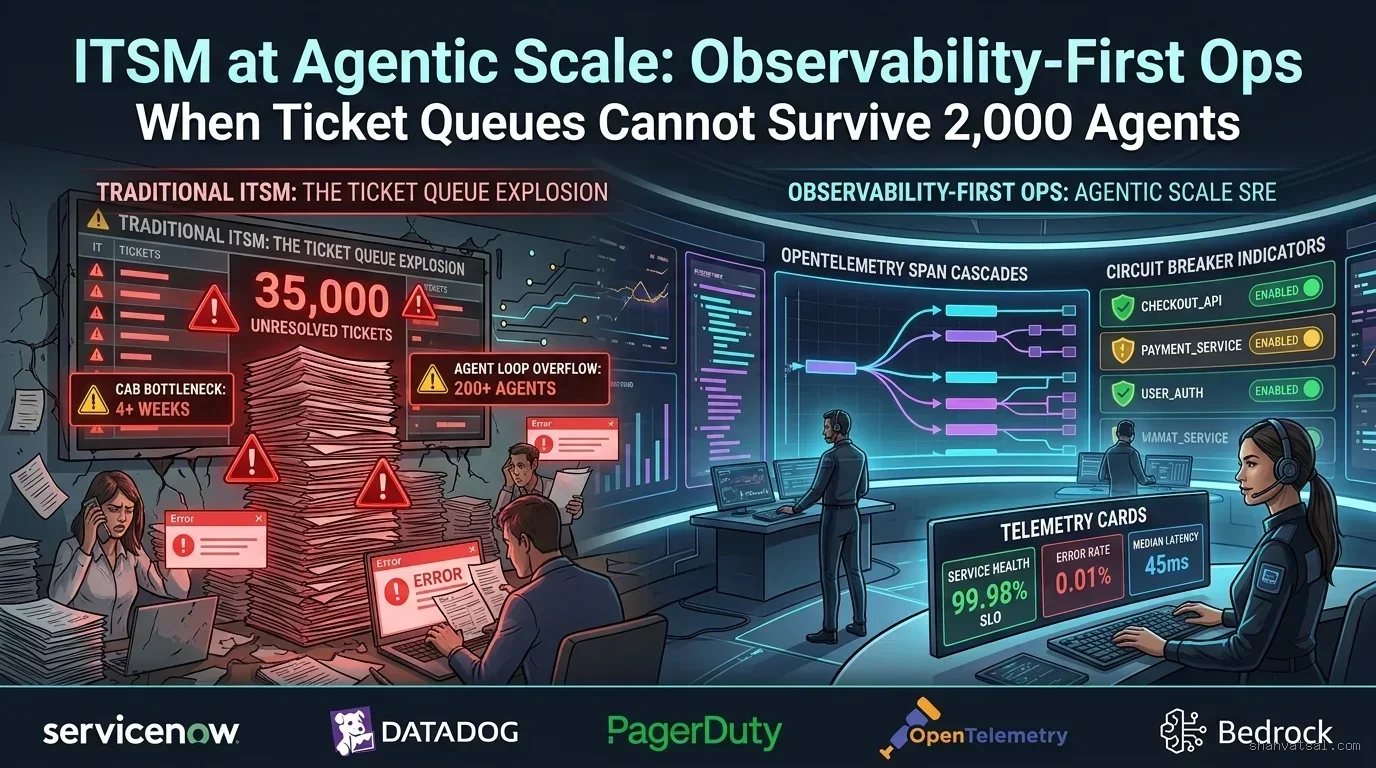
Executive Summary: The Structural Collapse of the IT Service Desk under Agentic Load
For nearly four decades, IT Service Management (ITSM) and the Information Technology Infrastructure Library (ITIL) frameworks operated under a single foundational premise: changes, incidents, and service requests are initiated by, routed through, and resolved by human beings. The entire operational apparatus of modern corporate IT—from ServiceNow incident queues and Jira Service Management tickets to weekly Change Advisory Board (CAB) review meetings—was architected around human cognitive latency. A ticket arrives, a Tier-1 support technician categorizes it within 4 hours, a Tier-2 engineer triages it within 24 hours, and an emergency change request requires a 45-minute committee deliberation before a patch is applied to production.
In 2026, this human-centric operational paradigm suffered a catastrophic structural collapse.
As enterprises scale beyond pilot experiments into full-blown digital operating models, organizations now routinely deploy fleets of 500 to 2,000+ autonomous agents across core business domains:
- Finance Pods reconciling continuous ledger entries via SAP S/4HANA APIs.
- Customer Operations Pods negotiating invoice disputes and initiating live ERP credit memos.
- DevOps & Cloud SRE Pods dynamically scaling Kubernetes clusters, modifying firewall rules, and deploying automated code pull requests.
                   ┌──────────────────────────────────────────────┐
                   │    Traditional Human-Centric Ticket Queue    │
                   │      (ServiceDesk Built for 500 Tickets/Day) │
                   └──────────────────────┬───────────────────────┘
                                          │
                 ┌────────────────────────┼────────────────────────┐
                 ▼                        ▼                        ▼
       [ 2,000 Agents Deployed ]  [ Tool Failures: 50/sec ]  [ Token Infinite Loops ]
                 │                        │                        │
                 └────────────────────────┼────────────────────────┘
                                          │
                                          ▼
                      [ 45,000 UNRESOLVED INCIDENT TICKETS ]
                      [ QUEUE SATURATION: 100% COLLAPSE ]
When 2,000 autonomous agents execute millions of multi-step cognitive reasoning cycles daily, they do not behave like human software users. They generate continuous configuration drift, stochastic tool-calling timeouts, prompt drift anomalies, sub-second policy-as-code violations, and recursive retry storms.
If an enterprise attempts to manage an agentic fleet using traditional ITIL ticketing:
- Ticket Queues Drown in Minutes: A single cascading API schema change in Salesforce CRM triggers 15,000 automated incident tickets in 90 seconds, completely paralyzing the IT service desk.
- Change Advisory Boards (CAB) Become Paralyzed: An agent graph updated with prompt refinements or new Model Context Protocol (MCP) tools cannot wait 14 days for a bi-weekly CAB meeting without freezing business agility.
- Traditional CMDBs Become Stale Instantly: Relational Configuration Management Databases (CMDBs) cannot track the dynamic, ephemeral dependencies between an autonomous agent identity, an underlying foundation model tier, transient MCP tool access tokens, and distributed vector embeddings.
The verdict of 2026 is definitive: Ticket-centric ITSM cannot survive agentic scale.
To operate high-density autonomous agent fleets without operational chaos or catastrophic downtime, enterprise IT must undergo a fundamental transition to Observability-First Operations. Under this paradigm, manual ticket routing is replaced by real-time OpenTelemetry span inspection, deterministic Cedar guardrails, automated circuit breakers, graph-native CMDBs, and specialized "On-Call for Agents" protocols.
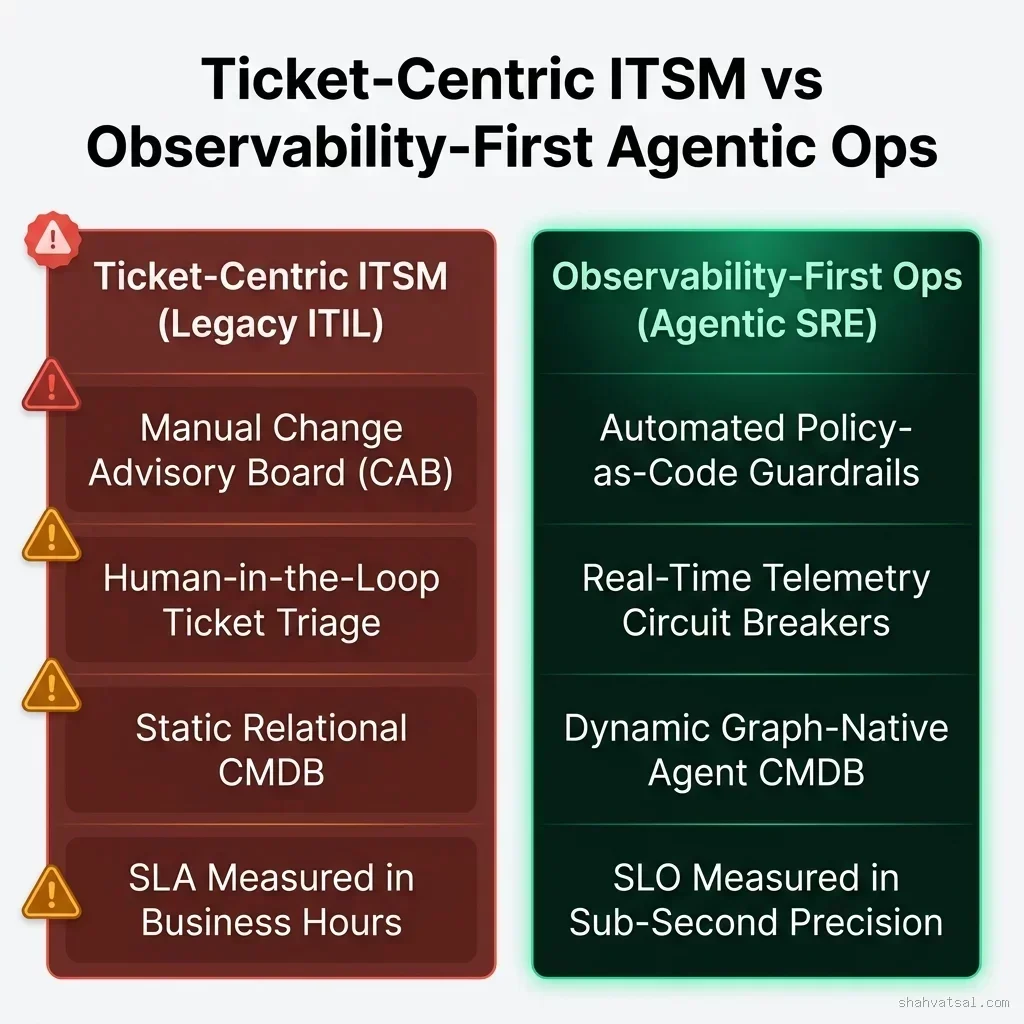
Failure Modes of Ticket-Centric ITSM under 2,000+ Agent Fleets
To architect an observability-first operating model, SRE leaders and enterprise CIOs must first diagnose the five fatal failure modes that emerge when traditional ITSM processes confront autonomous agent density.
The 5 Fatal Failure Modes of Legacy ITSM
┌───────────────────────────┬───────────────────────────┬───────────────────────────┐
│ Failure Mode              │ Root Cause at Scale       │ Operational Consequence   │
├───────────────────────────┼───────────────────────────┼───────────────────────────┤
│ 1. Infinite Retry Storms  │ Hallucinated tool inputs  │ Cloud token bill +$80,000 │
│                           │ or transient API timeouts │ in 2 hours; API throttling│
├───────────────────────────┼───────────────────────────┼───────────────────────────┤
│ 2. Cascading Ticket Aval  │ Downstream ERP schema chg │ 20,000+ auto-generated   │
│                           │ breaks 200 calling agents │ tickets swamp ServiceDesk │
├───────────────────────────┼───────────────────────────┼───────────────────────────┤
│ 3. Silent Authority Drift │ Prompt injection or state │ Agent modifies enterprise │
│                           │ corruption escapes check  │ records outside IAM scope │
├───────────────────────────┼───────────────────────────┼───────────────────────────┤
│ 4. CAB Gridlock           │ Weekly manual change revs │ Agent deployments stall;  │
│                           │ for daily prompt patches  │ engineering velocity = 0  │
├───────────────────────────┼───────────────────────────┼───────────────────────────┤
│ 5. Blind Context MTTD     │ Tickets lack execution    │ Mean Time to Detect > 48h │
│                           │ traces & scratchpad logs  │ MTTR extends to weeks     │
└───────────────────────────┴───────────────────────────┴───────────────────────────┘
1. The Recursive Loop & Token Exhaustion Storm
Unlike deterministic microservices that fail with explicit HTTP 500 error codes, autonomous agents rely on stochastic reasoning loops. If an external API returns an unexpected response payload, a poorly constrained agent may attempt to "re-reason" through the failure, modifying its prompt context and retrying the call indefinitely. At a scale of 2,000 agents, a sudden third-party network blip can plunge 300 agents into simultaneous infinite retry loops—burning \$80,000 in model inferencing tokens in under two hours while crashing enterprise rate limits. In legacy ITSM, this surfaces as an invoice discrepancy ticket three days later; in an Observability-First architecture, an automated telemetry circuit breaker trips within 800 milliseconds.
2. The Cascading Incident Ticket Avalanche
When human workers encounter an ERP error, they pause, discuss the issue on Slack, or log a single shared ticket. When 500 autonomous agents encounter a schema change in SAP S/4HANA, every single agent autonomously registers an error event. Within 120 seconds, the central IT service management tool is inundated with tens of thousands of duplicate incident records, triggering automated notification pagers and crashing IT helpdesk portals.
3. Silent Authority Drift & Privilege Escalation
In human organizations, privilege abuse is curtailed by peer observation and dual-control sign-offs. In autonomous agent fleets, an agent given broad credentials can experience "prompt drift" or subtle goal alignment failure. The agent does not "crash" or emit error logs; it successfully executes transactions that subtly violate corporate compliance mandates (e.g., approving supplier payments without dual-authorization or exfiltrating PII to third-party endpoints). Because no error ticket was generated, traditional ITSM remains completely blind until an annual SOX or GDPR audit reveals millions of dollars in non-compliant actions.
The 4 Observability Signals That Actually Matter for Agentic Systems
In legacy infrastructure monitoring, SRE teams rely on the classic "Four Golden Signals": Latency, Traffic, Errors, and Saturation. While these signals remain necessary for base Kubernetes containers, they are entirely insufficient for governing cognitive systems. An agent pod can show 0% container memory saturation, healthy CPU utilization, and 200 OK HTTP statuses while simultaneously producing 100% hallucinated output and leaking proprietary business context.
To govern 2,000+ autonomous agents, IT operations must instrument The Four Cognitive Observability Signals:
                       ┌──────────────────────────────────────────────┐
                       │    The 4 Cognitive Observability Signals     │
                       └──────────────────────┬───────────────────────┘
                                              │
         ┌───────────────────┬────────────────┴───────────────────┬───────────────────┐
         ▼                   ▼                                    ▼                   ▼
 ┌───────────────┐   ┌───────────────┐                    ┌───────────────┐   ┌───────────────┐
 │ 1. Synthetic  │   │ 2. MCP Tool   │                    │ 3. Authority  │   │ 4. FinOps     │
 │ Eval Precision│   │ Selection Err │                    │ Breach Rate   │   │ Cost/Outcome  │
 ├───────────────┤   ├───────────────┤                    ├───────────────┤   ├───────────────┤
 │ Real-time     │   │ Failed schema │                    │ Cedar Policy  │   │ Token burn    │
 │ hallucination │   │ conversions & │                    │ violations &  │   │ velocity per  │
 │ drift scoring │   │ retry loops   │                    │ scope drift   │   │ transaction   │
 └───────────────┘   └───────────────┘                    └───────────────┘   └───────────────┘
1. Synthetic Evaluation Precision & Hallucination Drift ($S_{\text{eval}}$)
Rather than waiting for downstream customer complaints, the observability mesh continuously samples 5% to 10% of production agent execution traces, streaming them asynchronously to an automated evaluation harness (LLM-as-a-judge + deterministic assertion engines).
The evaluation harness scores the trace against three rigorous dimensions:
- Faithfulness: Does the generated output contradict the retrieved context?
- Context Relevance: Did the agent retrieve extraneous or polluted vector context?
- Task Goal Attainment: Did the agent satisfy the caller's explicit criteria?
If the running 15-minute moving average of $S_{\text{eval}}$ drops below $98.2\%$, an automated canary degradation flag is raised.
2. MCP Tool Selection Precision & Schema Error Rate ($\epsilon_{\text{tool}}$)
Autonomous agents interact with enterprise systems via the Model Context Protocol (MCP). The primary failure mode in complex multi-step reasoning is tool selection failure: calling the wrong tool, hallucinating parameters, or failing to parse the return schema:
$$\epsilon_{\text{tool}} = \frac{\mathcal{N}{\text{Failed Tool Invocations}} + \mathcal{N}{\text{Parameter Mismatches}}}{\mathcal{N}_{\text{Total Tool Invocations}}}$$
When $\epsilon_{\text{tool}} > 1.2\%$ over a 5-minute window, the agent is immediately throttled before it can corrupt state across production databases.
3. Policy-as-Code Authority Breaches ($\mathcal{A}_{\text{breach}}$)
Every action attempted by an agent must be validated by a deterministic policy engine (such as AWS Cedar or Open Policy Agent). Authority breaches track how frequently an agent attempts an action outside its cryptographic permissions boundary:
- Attempting to query financial records outside its domain cost center.
- Attempting to execute wire transfers without human-in-the-loop signatures.
- Attempting egress communication to unapproved internet endpoints.
A non-zero spike in $\mathcal{A}_{\text{breach}}$ indicates either active prompt injection or severe context corruption, triggering immediate agent quarantine.
4. Cost-per-Outcome & Token Burn Velocity ($C_{\text{outcome}}$)
Traditional cloud infrastructure costs are evaluated at month-end. At agentic scale, an unmonitored agent bug can rack up tens of thousands of dollars in LLM inference costs within hours. Real-time telemetry must measure token expenditure relative to business value produced:
$$C_{\text{outcome}} = \frac{\sum \text{Prompt Tokens} \times P_{\text{in}} + \sum \text{Completion Tokens} \times P_{\text{out}}}{\mathcal{N}_{\text{Successfully Settled Business Transactions}}}$$
If $C_{\text{outcome}}$ spikes $>3\times$ above the historical baseline, the observability engine automatically steps the agent down to a cost-optimized model tier (e.g., from GPT-5.6 Sol to GPT-5.6 Luna) or trips an emergency circuit breaker.
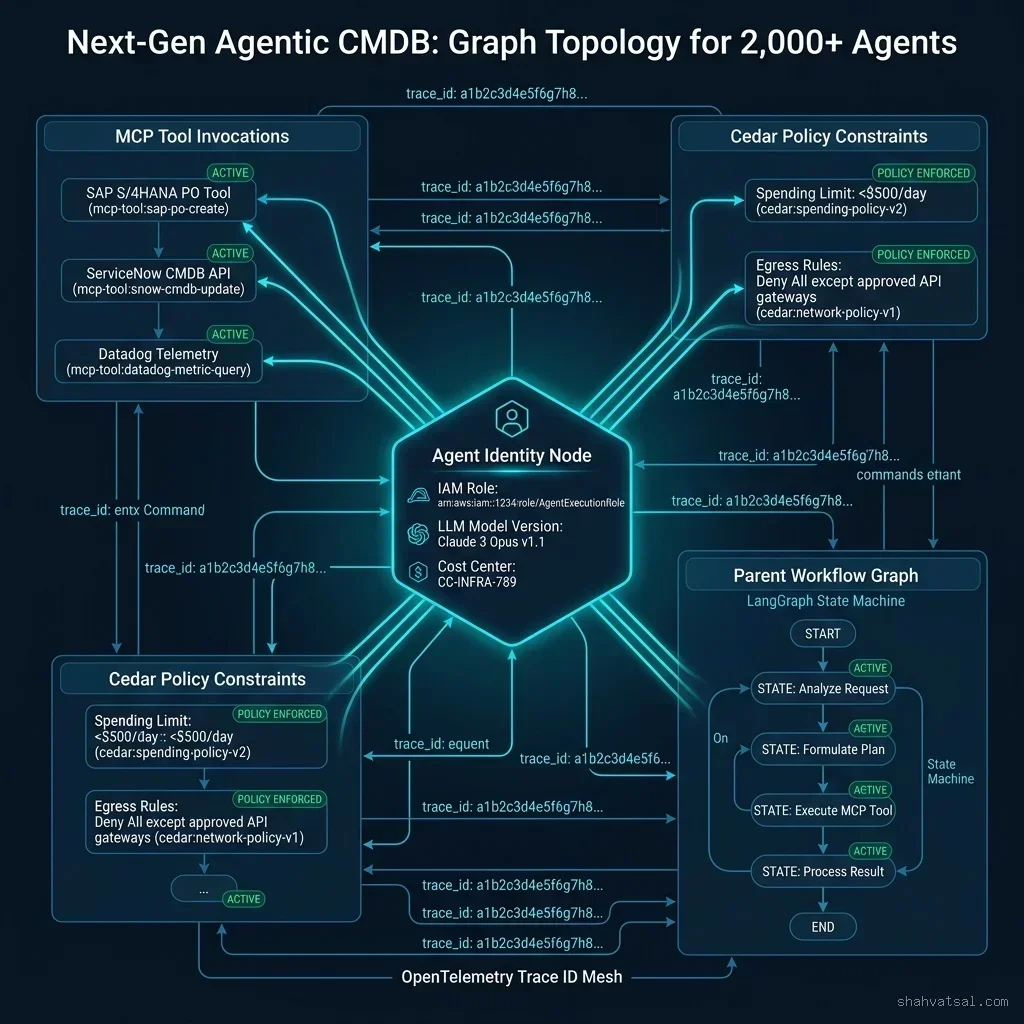
The Agentic CMDB Redesign: Graph Topologies for 2,000+ Agents
Traditional Configuration Management Databases (CMDBs) are relational, static, and human-updated. They record which physical server hosts an Apache instance or which employee is assigned a corporate laptop.
In an enterprise running 2,000 autonomous agents, a relational CMDB is completely useless. An agent is not a static server; it is an ephemeral cognitive identity that dynamically links foundation models, vector databases, tool APIs, and business data:
                          ┌───────────────────────────┐
                          │     Agent Identity Node   │
                          │  (IAM Role, Model, Owner) │
                          └─────────────┬─────────────┘
                                        │
         ┌──────────────────────────────┼──────────────────────────────┐
         ▼                              ▼                              ▼
 ┌───────────────┐              ┌───────────────┐              ┌───────────────┐
 │ MCP Tool Fleet│              │ Cedar Guard   │              │ State Machine │
 │ (SAP, Workday)│              │ (Spend Limits)│              │ (LangGraph)   │
 └───────┬───────┘              └───────┬───────┘              └───────┬───────┘
         │                              │                              │
         └──────────────────────────────┼──────────────────────────────┘
                                        │
                                        ▼
                        [ OpenTelemetry Trace ID Mesh ]
The 5 Core Entities of the Agentic Graph CMDB
- Agent Identity Node (
Agent_CI):
- Unique cryptographic agent ID (agent-uuid-v4).
- Assigned enterprise IAM role and execution credentials.
- Owning business unit and cost-center accounting code.
- Assigned human supervisory escalation engineer.
- Model Engine Node (
Model_CI):
- Foundation model family and exact pinned snapshot version (gpt-5-6-terra-2026-04-12 or claude-3-7-sonnet-v1).
- Underlying inference provider (AWS Bedrock, Azure AI Foundry, Vertex AI, or on-prem vLLM).
- Temperature, max token bounds, and reasoning effort configurations.
- MCP Tool Registry Nodes (
Tool_CI):
- Registered Model Context Protocol endpoints (e.g., mcp-tool:sap-po-reconcile).
- JSON-RPC parameter schemas and validation contracts.
- Execution environment (isolated sandbox container vs. direct VPC gateway).
- Policy-as-Code Constraint Nodes (
Policy_CI):
- Compiled Cedar or OPA policy files governing the agent.
- Transaction dollar limits, read-only vs. write scopes, and data residency boundary rules.
- Dynamic Trace Edge Mesh (
Telemetry_Edge):
- Real-time OpenTelemetry span correlation linking every production transaction to its parent Agent, Model snapshot, and Tool invocation graph.
When an incident occurs, the SRE team does not manually search a spreadsheet. They query the Agentic Graph CMDB via GraphQL or Cypher to instantly identify all 45 agents currently invoking an unstable SAP MCP tool, executing a fleet-wide automated policy update in seconds.
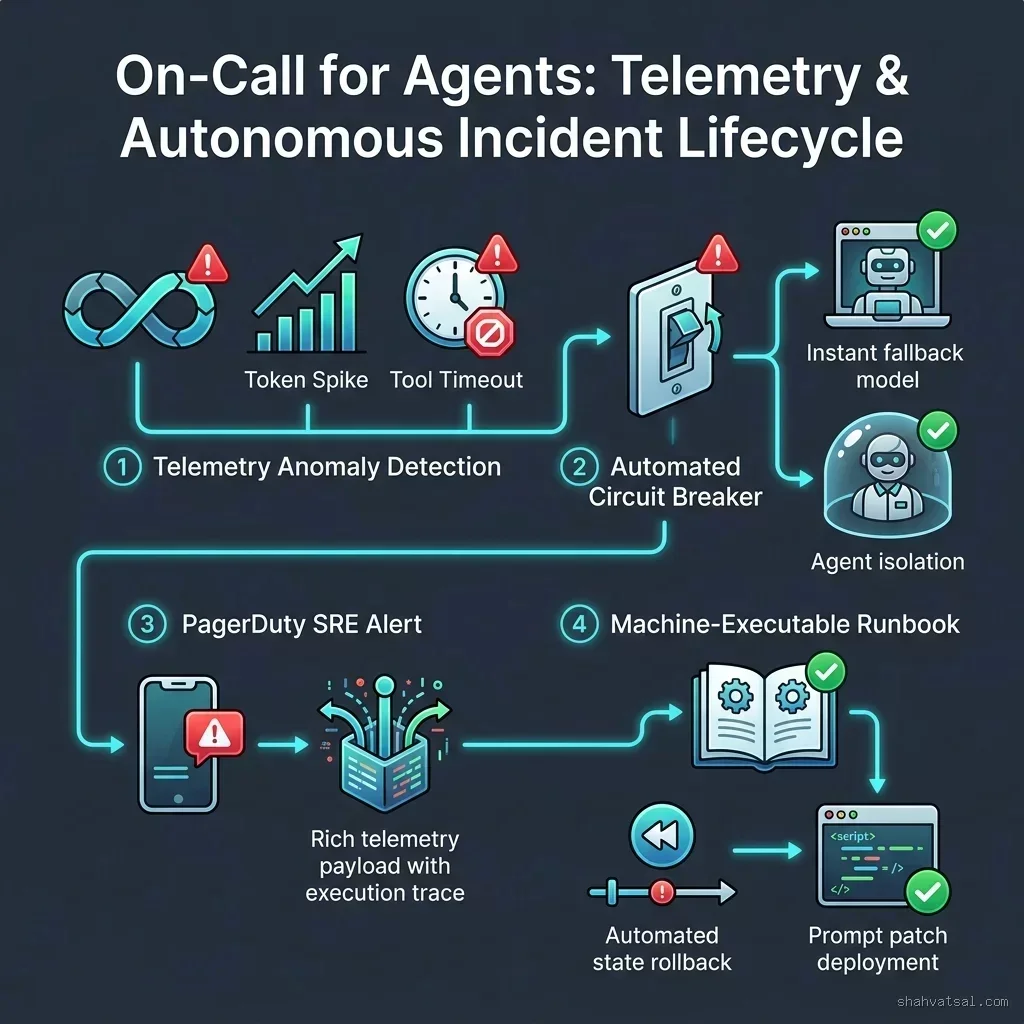
On-Call for Agents: The Telemetry-Driven Autonomous Incident Lifecycle
One of the most profound cultural shifts in enterprise IT is answering the question: "Who gets paged at 3:00 AM when an autonomous agent fails?"
In legacy ITIL, if an automated script fails, an alert pages a human sysadmin, who logs into a VPN, opens a terminal, runs diagnostic shell scripts, and attempts to recover state. At agentic scale—where hundreds of agents can encounter localized anomalies every hour—paging human engineers for every agent hiccup results in catastrophic alert fatigue and engineer burnout.
The modern operating model introduces the Autonomous 4-Stage Incident Lifecycle:
 [STAGE 1: Telemetry Anomaly Detection]
        │  • OpenTelemetry collector flags token spike (>3x baseline)
        │  • MCP Tool error rate breaches 1.2% threshold
        ▼
 [STAGE 2: Automated Circuit Breakers & Quarantine]
        │  • Circuit breaker trips in < 800ms
        │  • Agent isolated; traffic routed to fallback model or queue
        │  • Zero-touch state freeze prevents database corruption
        ▼
 [STAGE 3: Automated Machine-Executable Runbook Execution]
        │  • Runbook engine clears transient vector cache
        │  • Retries transaction against deterministic golden prompt
        │  • If resolved ──> Auto-recovery log emitted; incident closed
        ▼
 [STAGE 4: High-Leverage SRE Paging (Human Escalation)]
        │  • PagerDuty alert fired ONLY class="tok-kw">if automated runbook fails
        │  • Engineer receives pre-compiled trace, prompt diff, and fix PR
The SRE On-Call Contract for Agentic Fleets
- Rule 1: Never Page a Human for a Known Exception. If an agent hallucinates or loops, the platform circuit breaker must automatically isolate the agent and execute a self-healing rollback. Humans are paged only when the automated runbook fails to restore nominal state.
- Rule 2: Every Page Must Include Full Trace Lineage. When a Cognitive SRE Engineer receives a PagerDuty alert, the notification payload must contain:
1. The exact OpenTelemetry trace ID spanning all multi-agent turns.
2. The full reasoning scratchpad, model input prompt, and tool response payload.
3. The specific Cedar policy assertion that failed.
4. An auto-generated git pull request rolling back the prompt or tool schema to the last known healthy release.
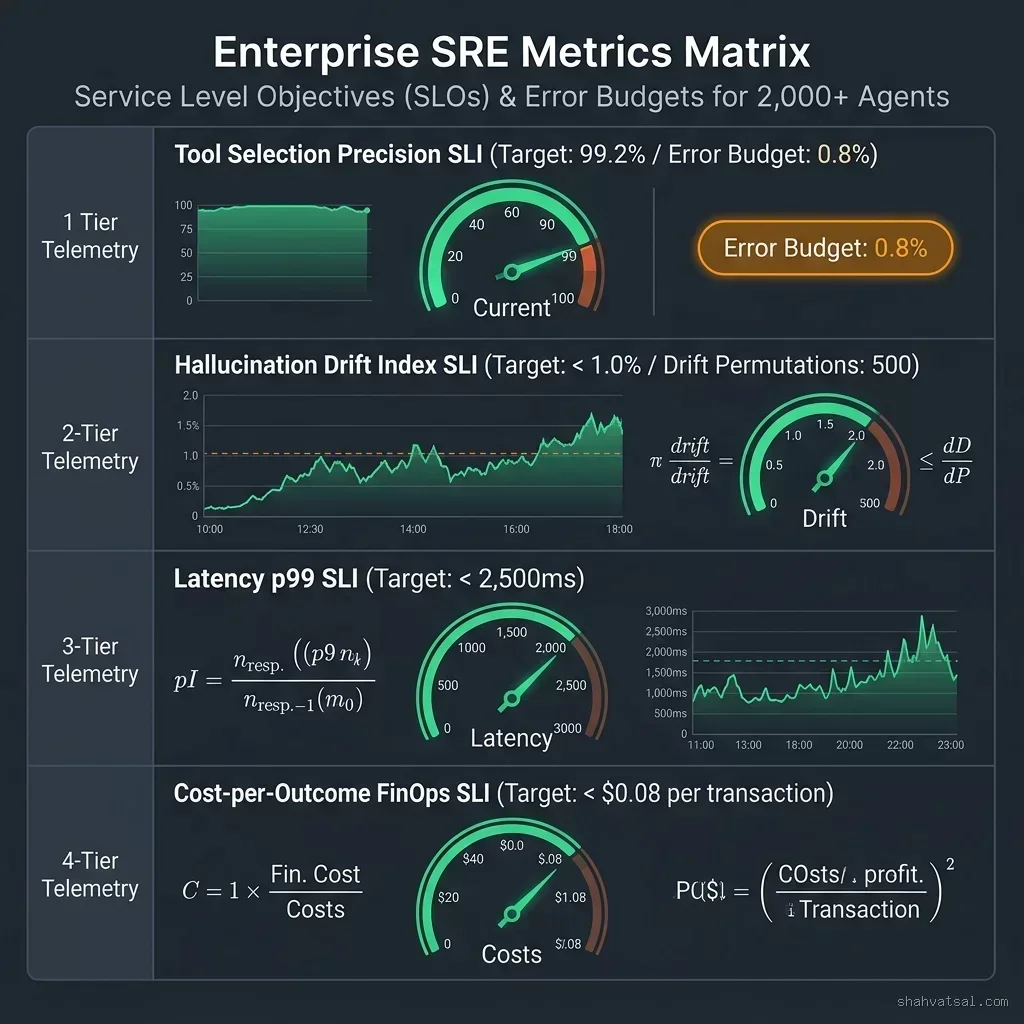
Defining SLAs and SLOs for Autonomous Agentic Services
In traditional ITSM, Service Level Agreements (SLAs) are defined by uptime and human turnaround time: "99.9% portal availability; Severity-1 tickets acknowledged within 15 minutes."
For autonomous agentic services, uptime is meaningless. An agent endpoint can report 100.0% HTTP availability while returning completely invalid, non-compliant business decisions.
Enterprise SRE teams must establish Cognitive Service Level Objectives (SLOs) backed by explicit Error Budgets:
┌────────────────────────────────────────────────────────────────────────────────────────┐
│                        AGENTIC SRE SLO & ERROR BUDGET MATRIX                           │
├────────────────────────────────────────┬─────────────┬──────────────┬──────────────────┤
│ Service Level Indicator (SLI)          │ Target SLO  │ Error Budget │ Automated Action │
├────────────────────────────────────────┼─────────────┼──────────────┼──────────────────┤
│ 1. Tool Selection Precision ($P_{\text{tool}}$) │ 99.2%       │ 0.8%         │ Deploy freeze    │
│ 2. Hallucination Drift Index ($H_d$)   │ < 1.0%      │ 1.0%         │ Canary rollback  │
│ 3. End-to-End Latency p99              │ < 2,500ms   │ 5.0%         │ Model tier step  │
│ 4. Cost-per-Outcome ($C_{\text{tx}}$)  │ < $0.08     │ 10% variance │ Budget throttle  │
└────────────────────────────────────────┴─────────────┴──────────────┴──────────────────┘
Managing the Cognitive Error Budget
Just as in classical Site Reliability Engineering, the Error Budget governs development velocity:
- Nominal State (Budget Remaining > 20%): Domain engineering squads possess full autonomy to deploy new prompt variations, add new MCP tools, and experiment with alternative model tiers via self-service CI/CD pipelines.
- Exhausted State (Budget Burned 100%): If tool selection errors or hallucination drift consume the monthly error budget, all production deployments for that specific agent squad are automatically frozen. Engineering capacity is immediately redirected to curating golden evaluation datasets and hardening Cedar security policies until reliability is restored.
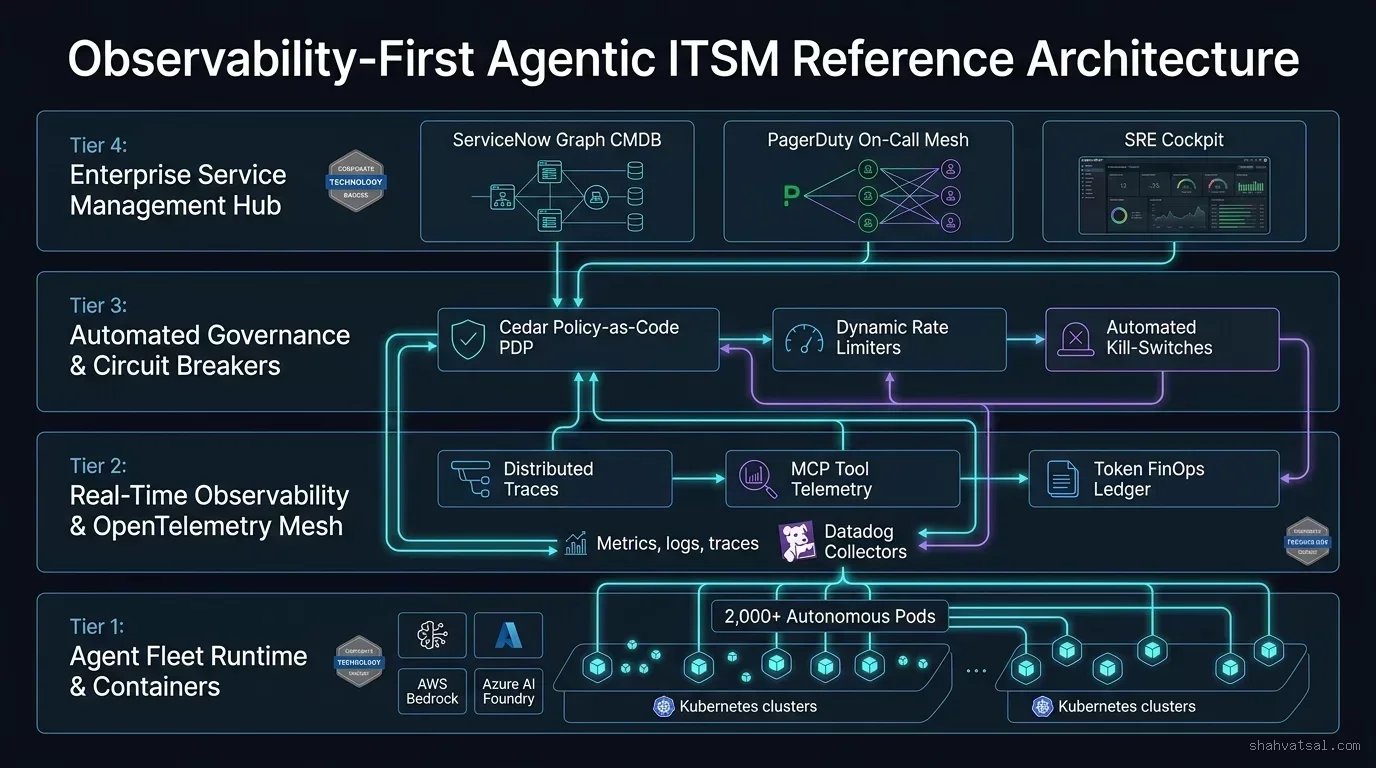
Enterprise Technical Reference Architecture for Observability-First ITSM
To replace fragile ticket queues with an observability-first operations fabric, enterprise IT must deploy a unified 4-tier systems architecture.
Tier 1: Agent Fleet Runtime Plane
- Container Infrastructure: 2,000+ containerized agent pods running on hardened Kubernetes / Red Hat OpenShift clusters across AWS, Azure, and private sovereign data centers.
- Foundation Model Backbones: Multi-model routing gateways accessing AWS Bedrock, Azure AI Foundry, Google Cloud Vertex AI, and local vLLM inference instances.
Tier 2: Real-Time Observability & OpenTelemetry Mesh Plane
- OpenTelemetry Instrumentation: Native span injection capturing every agent prompt, reasoning step, MCP tool request, and completion payload.
- Enterprise Collector Fleet: Datadog and OpenTelemetry collectors streaming metrics, logs, and traces into high-throughput storage (ClickHouse, Elasticsearch, Splunk).
- FinOps Telemetry Ledger: Real-time token consumption tracking attributing cost to specific domain cost centers.
Tier 3: Automated Governance & Circuit Breakers Plane
- Policy Decision Points (PDP): Real-time Cedar and OPA policy evaluation intercepting all agent tool invocations within $<1.5\text{ms}$.
- Dynamic Circuit Breakers: Redis-backed rate limiters and stateful circuit breakers that isolate looping agents, restrict burst inference, and prevent cascading database deadlocks.
Tier 4: Enterprise Service Management Hub Plane
- ServiceNow Graph CMDB: Graph-native configuration management tracking agent identities, model versions, tool dependencies, and policy contracts.
- PagerDuty On-Call Routing: High-fidelity incident routing paging cognitive SREs only for unresolvable anomalies with rich trace payloads.
- SRE Supervisory Cockpit: Unified single-pane-of-glass dashboard displaying real-time cognitive SLO adherence, straight-through processing rates, and fleet health heatmaps.
4-Phase Enterprise Migration Roadmap: From ITIL-Heavy to Observability-First
Migrating an enterprise from slow, ticket-centric ITSM to an automated, observability-first operating model requires a disciplined 12-month transformation roadmap.
 ┌──────────────────────────────────────────────────────────────────────────────────┐
 │ Phase 0 (Month 1-2): Observability Instrumentation & Baseline Telemetry          │
 │ • Deploy OpenTelemetry agent hooks; establish real-time token FinOps tracking.   │
 ├──────────────────────────────────────────────────────────────────────────────────┤
 │ Phase 1 (Month 3-5): Automated Circuit Breakers & Policy Guardrails              │
 │ • Implement Cedar Policy PDP; activate automated circuit breakers on tool errors.│
 ├──────────────────────────────────────────────────────────────────────────────────┤
 │ Phase 2 (Month 6-8): Graph CMDB & class="tok-str">"On-Call for Agents" Protocol                  │
 │ • Upgrade ServiceNow/JSM to Graph CMDB; deploy PagerDuty cognitive alert routing.│
 ├──────────────────────────────────────────────────────────────────────────────────┤
 │ Phase 3 (Month 9-12): Full ITIL Deprecation & Self-Healing SRE Scale             │
 │ • Replace manual CAB with automated CI/CD eval gates; activate machine runbooks. │
 └──────────────────────────────────────────────────────────────────────────────────┘
Transition Checklist for CIOs and IT Operations Leaders
- [ ] **Phase 0: Instrumentation & Baselines (Months 1–2)**
  - [ ] Instrument all production agent frameworks (LangGraph, CrewAI, AutoGen) with OpenTelemetry collectors.
  - [ ] Implement real-time token tracking linking every model call to a domain General Ledger cost center.
  - [ ] Establish baseline benchmarks for tool selection precision, hallucination drift, and p99 latency.

- [ ] **Phase 1: Automated Guardrails & Circuit Breakers (Months 3–5)**
  - [ ] Deploy central Cedar Policy Decision Point (PDP) intercepting all Model Context Protocol (MCP) tool calls.
  - [ ] Configure automated circuit breakers tripping on $\ge 5$ consecutive retries or $>3\times$ token spikes.
  - [ ] Implement fallback routing directing traffic to deterministic cached responses or human queues.

- [ ] **Phase 2: Graph CMDB & Incident Routing (Months 6–8)**
  - [ ] Extend enterprise CMDB (ServiceNow / Jira Service Management) with agent identity and tool dependency schemas.
  - [ ] Establish class="tok-str">"On-Call for Agents" rotation with PagerDuty / Opsgenie integrated with full execution trace payloads.
  - [ ] Author machine-executable runbooks capable of executing automated state rollbacks and prompt patches.

- [ ] **Phase 3: Continuous Governance & Scale (Months 9–12)**
  - [ ] Formally eliminate manual Change Advisory Board (CAB) reviews for prompt and tool modifications.
  - [ ] Enforce automated CI/CD synthetic evaluation gates as the sole prerequisite for production promotion.
  - [ ] Establish Cognitive SLOs and automated deployment freezes based on error budget consumption.
Production Implementation Artifacts
To accelerate implementation, enterprise platform teams can deploy the following production-ready architectural templates.
1. Real-Time OpenTelemetry & Circuit Breaker Telemetry Interceptor (Python / FastAPI)
class="tok-str">""class="tok-str">"
Enterprise Agentic ITSM - Real-Time Observability & Circuit Breaker Gateway
Enforces OpenTelemetry distributed tracing, Cedar policy authorization, and automated circuit breaking.
"class="tok-str">""

from fastapi import FastAPI, HTTPException, Header, Request, Depends
from pydantic import BaseModel, Field
import structlog
import time
import redis.asyncio as redis
from typing import Dict, Any, Optional

logger = structlog.get_logger()
app = FastAPI(title=class="tok-str">"Agentic ITSM Observability Gateway", version=class="tok-str">"2.0.0")

class="tok-cm"># Redis Client for Circuit Breakers and Token Counters
redis_client = redis.Redis(host=class="tok-str">"localhost", port=6379, db=0, decode_responses=True)

class="tok-cm"># Circuit Breaker Thresholds
MAX_CONSECUTIVE_ERRORS = 5
ERROR_WINDOW_SECONDS = 60
TOKEN_BURST_LIMIT = 20_000

class ToolInvocationPayload(BaseModel):
    agent_id: str = Field(..., description=class="tok-str">"Unique agent cryptographic identity")
    trace_id: str = Field(..., description=class="tok-str">"OpenTelemetry root trace identifier")
    tool_name: str = Field(..., description=class="tok-str">"MCP tool name, e.g., &class="tok-cm">#039;sap_po_approve'")
    parameters: Dict[str, Any]
    prompt_tokens: int
    completion_tokens: int

async class="tok-kw">def check_circuit_breaker(agent_id: str):
    breaker_key = fclass="tok-str">"circuit_breaker:{agent_id}"
    is_open = await redis_client.get(breaker_key)
    if is_open:
        logger.error(class="tok-str">"circuit_breaker_tripped", agent_id=agent_id, reason=class="tok-str">"Quarantine Active")
        raise HTTPException(
            status_code=503,
            detail=fclass="tok-str">"Agent {agent_id} is quarantined due to consecutive operational anomalies. Escalating to SRE."
        )

@app.post(class="tok-str">"/v1/itsm/intercept-tool-call")
async class="tok-kw">def intercept_and_trace_tool_call(
    payload: ToolInvocationPayload,
    authorization: str = Header(...),
    _: None = Depends(check_circuit_breaker)
):
    start_time = time.perf_counter()
    agent_error_counter_key = fclass="tok-str">"errors:{payload.agent_id}"

    class="tok-cm"># 1. Real-Time FinOps Token Spike Validation
    total_tokens = payload.prompt_tokens + payload.completion_tokens
    if total_tokens > TOKEN_BURST_LIMIT:
        await redis_client.setex(fclass="tok-str">"circuit_breaker:{payload.agent_id}", 300, class="tok-str">"TOKEN_BURST")
        logger.warn(class="tok-str">"token_burst_circuit_breaker_tripped", agent_id=payload.agent_id, tokens=total_tokens)
        raise HTTPException(status_code=429, detail=class="tok-str">"Excessive token burst detected. Agent throttled.")

    class="tok-cm"># 2. Simulated Cedar Policy-as-Code Authorization
    class="tok-cm"># In production: cedar.is_authorized(principal=payload.agent_id, action=payload.tool_name, resource=...)
    is_authorized = True
    if not is_authorized:
        logger.error(class="tok-str">"cedar_policy_violation", agent=payload.agent_id, tool=payload.tool_name)
        raise HTTPException(status_code=403, detail=class="tok-str">"Cedar policy constraint violation. Action denied.")

    class="tok-cm"># 3. Simulate Tool Execution
    class="tok-cm"># Tool execution happens inside isolated sandbox
    execution_success = True
    latency_ms = round((time.perf_counter() - start_time) * 1000, 2)

    if not execution_success:
        current_errors = await redis_client.incr(agent_error_counter_key)
        await redis_client.expire(agent_error_counter_key, ERROR_WINDOW_SECONDS)

        if current_errors >= MAX_CONSECUTIVE_ERRORS:
            await redis_client.setex(fclass="tok-str">"circuit_breaker:{payload.agent_id}", 600, class="tok-str">"CONSECUTIVE_FAILURES")
            logger.critical(class="tok-str">"agent_quarantined", agent_id=payload.agent_id, errors=current_errors)

        raise HTTPException(status_code=502, detail=class="tok-str">"Tool execution error. Counter incremented.")

    class="tok-cm"># Reset error counter on success
    await redis_client.delete(agent_error_counter_key)

    class="tok-cm"># 4. Emit OpenTelemetry-Compatible Structured Telemetry
    logger.info(
        class="tok-str">"agentic_tool_invocation_success",
        trace_id=payload.trace_id,
        agent_id=payload.agent_id,
        tool=payload.tool_name,
        latency_ms=latency_ms,
        total_tokens=total_tokens,
        status=class="tok-str">"EXECUTED"
    )

    return {
        class="tok-str">"status": class="tok-str">"SUCCESS",
        class="tok-str">"trace_id": payload.trace_id,
        class="tok-str">"latency_ms": latency_ms,
        class="tok-str">"circuit_breaker": class="tok-str">"CLOSED"
    }
2. Machine-Executable Incident Auto-Remediation Runbook (JSON Specification)
{
  class="tok-str">"$schema": class="tok-str">"https:class="tok-cm">//schemas.enterprise-sre.org/v2/agentic-runbook.json",
  class="tok-str">"runbook_id": class="tok-str">"RUNBOOK-AGENT-LOOP-084",
  class="tok-str">"title": class="tok-str">"Autonomous Remediation of Recursive Agent Retry Storms",
  class="tok-str">"trigger_condition": {
    class="tok-str">"telemetry_metric": class="tok-str">"itsm.tool.retry_count",
    class="tok-str">"threshold": 5,
    class="tok-str">"evaluation_window_seconds": 60
  },
  class="tok-str">"actions": [
    {
      class="tok-str">"step": 1,
      class="tok-str">"action_type": class="tok-str">"CIRCUIT_BREAKER_TRIP",
      class="tok-str">"target": class="tok-str">"agent_execution_runtime",
      class="tok-str">"parameters": {
        class="tok-str">"isolation_mode": class="tok-str">"CANARY_FALLBACK",
        class="tok-str">"ttl_seconds": 300
      }
    },
    {
      class="tok-str">"step": 2,
      class="tok-str">"action_type": class="tok-str">"FLUSH_VECTOR_SESSION_CACHE",
      class="tok-str">"target": class="tok-str">"agent_session_store",
      class="tok-str">"parameters": {
        class="tok-str">"session_id": class="tok-str">"${context.session_id}"
      }
    },
    {
      class="tok-str">"step": 3,
      class="tok-str">"action_type": class="tok-str">"PIN_MODEL_FALLBACK",
      class="tok-str">"target": class="tok-str">"model_gateway",
      class="tok-str">"parameters": {
        class="tok-str">"fallback_model_tier": class="tok-str">"deterministic-v2",
        class="tok-str">"temperature": 0.0
      }
    },
    {
      class="tok-str">"step": 4,
      class="tok-str">"action_type": class="tok-str">"DISPATCH_SRE_NOTIFICATION",
      class="tok-str">"target": class="tok-str">"pagerduty",
      class="tok-str">"parameters": {
        class="tok-str">"service_key": class="tok-str">"PD_AGENTIC_SRE_CORE",
        class="tok-str">"severity": class="tok-str">"P2_WARNING",
        class="tok-str">"auto_resolve": true,
        class="tok-str">"include_payload_keys": [class="tok-str">"trace_id", class="tok-str">"agent_id", class="tok-str">"token_burn_usd"]
      }
    }
  ]
}
3. Agentic CMDB Graph Schema (Neo4j / Cypher)
class="tok-cm">// Next-Generation Agentic CMDB Graph Schema Definition
class="tok-cm">// Models dynamic relationships between Agent Identities, Model Lineage, MCP Tools, and Policies

class="tok-cm">// 1. Create Agent Identity Node
CREATE (a:Agent_CI {
    agent_id: class="tok-str">"fin-ap-settlement-089",
    name: class="tok-str">"Accounts Payable Autonomous Settlement Agent",
    domain: class="tok-str">"Corporate Finance",
    cost_center: class="tok-str">"CC-FIN-4100",
    created_at: datetime(),
    status: class="tok-str">"Production_Graduated"
});

class="tok-cm">// 2. Link Agent to Foundation Model Lineage
MATCH (a:Agent_CI {agent_id: class="tok-str">"fin-ap-settlement-089"})
CREATE (m:Model_CI {
    model_family: class="tok-str">"Anthropic Claude 3.7",
    snapshot_id: class="tok-str">"claude-3-7-sonnet-2026-03-20",
    inference_host: class="tok-str">"AWS Bedrock us-east-1",
    max_tokens: 4096,
    temperature: 0.1
})
CREATE (a)-[:USES_MODEL {routing_priority: 1}]->(m);

class="tok-cm">// 3. Link Agent to Governed MCP Tool Fleet
MATCH (a:Agent_CI {agent_id: class="tok-str">"fin-ap-settlement-089"})
CREATE (t:MCP_Tool_CI {
    tool_id: class="tok-str">"mcp-sap-po-match",
    endpoint: class="tok-str">"https:class="tok-cm">//mcp-gateway.corp.internal/v1/tools/sap_po_match",
    auth_scope: class="tok-str">"SAP_FIN_READ_WRITE",
    timeout_ms: 1500
})
CREATE (a)-[:PERMITTED_TOOL {max_invocations_per_minute: 60}]->(t);

class="tok-cm">// 4. Link Agent to Deterministic Cedar Policy Guardrail
MATCH (a:Agent_CI {agent_id: class="tok-str">"fin-ap-settlement-089"})
CREATE (p:Policy_CI {
    policy_id: class="tok-str">"cedar-fin-limits-v3",
    spending_ceiling_usd: 5000.00,
    dual_custody_required: true,
    sovereign_region: class="tok-str">"US_EAST"
})
CREATE (a)-[:GOVERNED_BY]->(p);
Frequently Asked Questions (FAQ)
What is the primary difference between traditional ITSM and Agentic SRE?
Traditional ITSM (ITIL) is built for human workers; it manages changes and incidents through manual ticket categorization, human approval boards (CAB), and static relational CMDBs with response SLAs measured in hours or days. Agentic SRE (Observability-First Ops) is built for autonomous machines; it manages agent fleets through automated policy-as-code guardrails, real-time OpenTelemetry span telemetry, graph-native dynamic CMDBs, and sub-second automated circuit breakers.
Can an enterprise continue using ServiceNow or Jira Service Management in an agentic operating model?
Yes, but their role must be radically refactored. Rather than functioning as a manual ticket dispatch queue for human engineers, ServiceNow or Jira Service Management becomes an aggregated system of record and graph-native CMDB. Incidents are not logged by humans; they are ingested via high-throughput webhooks from OpenTelemetry and Datadog collectors, evaluated against automated runbooks, and surfaced to human engineers only when automated remediation fails.
What is a "Machine-Executable Runbook"?
A traditional runbook is a human-readable wiki page instructing an engineer which commands to type. A Machine-Executable Runbook is a structured, declarative specification (written in JSON or YAML) that an autonomous orchestration engine can parse and execute safely—such as flushing an agent's vector cache, stepping down model temperature, pinning a fallback API endpoint, or tripping a circuit breaker without human intervention.
How does Policy-as-Code replace the Change Advisory Board (CAB)?
Traditional CAB meetings exist to assess the risk of software deployments via human discussion. In an agentic operating model, prompt modifications, model tier changes, and MCP tool additions occur daily. By formalizing enterprise security, compliance, and architectural rules into Policy-as-Code (such as Cedar or OPA), a CI/CD evaluation harness can statically prove compliance and run hundreds of synthetic regression tests in minutes, rendering bi-weekly manual CAB meetings redundant.
Conclusion & Next Steps
The proliferation of autonomous agent fleets marks the permanent retirement of ticket-centric IT service management. When thousands of autonomous cognitive agents interact with enterprise systems at microsecond speed, organizations that rely on human-in-the-loop ticketing will find their IT departments crippled by queue saturation, operational drift, and runaway cloud expenditures.
By adopting Observability-First Operations—anchored in real-time cognitive telemetry, deterministic Cedar guardrails, automated circuit breakers, graph-native CMDBs, and machine-executable runbooks—enterprise IT leaders build the resilient, self-healing operational foundation required to govern autonomous agentic transformation at scale.
Immediate Action Plan for IT Leaders:
- Audit Incident Ticket Sources: Identify automated error tickets generated by bots and agents, and decouple them from human service desk queues.
- Deploy OpenTelemetry Distributed Tracing: Instrument all internal agent runtimes to capture full prompt, reasoning, and MCP tool invocation lineages.
- Implement Redis-Backed Circuit Breakers: Prevent runaway token bills and cascading database deadlocks by enforcing automatic isolation on looping agents.
- Transition from Relational to Graph CMDB: Model dynamic dependencies between agent identities, model versions, tool APIs, and policy contracts.