Board-Grade AI Scorecards: Metrics CFOs Actually Accept for Agent Programs
By Vatsal Shah | July 23, 2026 | 14 min read
Table of Contents
- The 12% Problem
- Why AI Dashboards Fail at the Board Level
- The Four Levels of AI Metrics
- The Anti-Metrics Catalog: What to Delete Immediately
- Building the Board-Grade AI Scorecard
- The Financial Case Framework (With Numbers)
- Agent-Specific Metrics That CFOs Understand
- Constructing the NPV and Payback Case
- Deep Analysis: Scorecard Maturity Benchmark Table
- Real-World Scorecard Patterns
- Presenting to the Board: Structure and Language
- Pitfalls and Anti-Patterns
- 2027-2030: The Future of AI Program Governance
- 90-Day Transformation Checkpoint
- Key Takeaways
- FAQ
- About the Author
- Conclusion
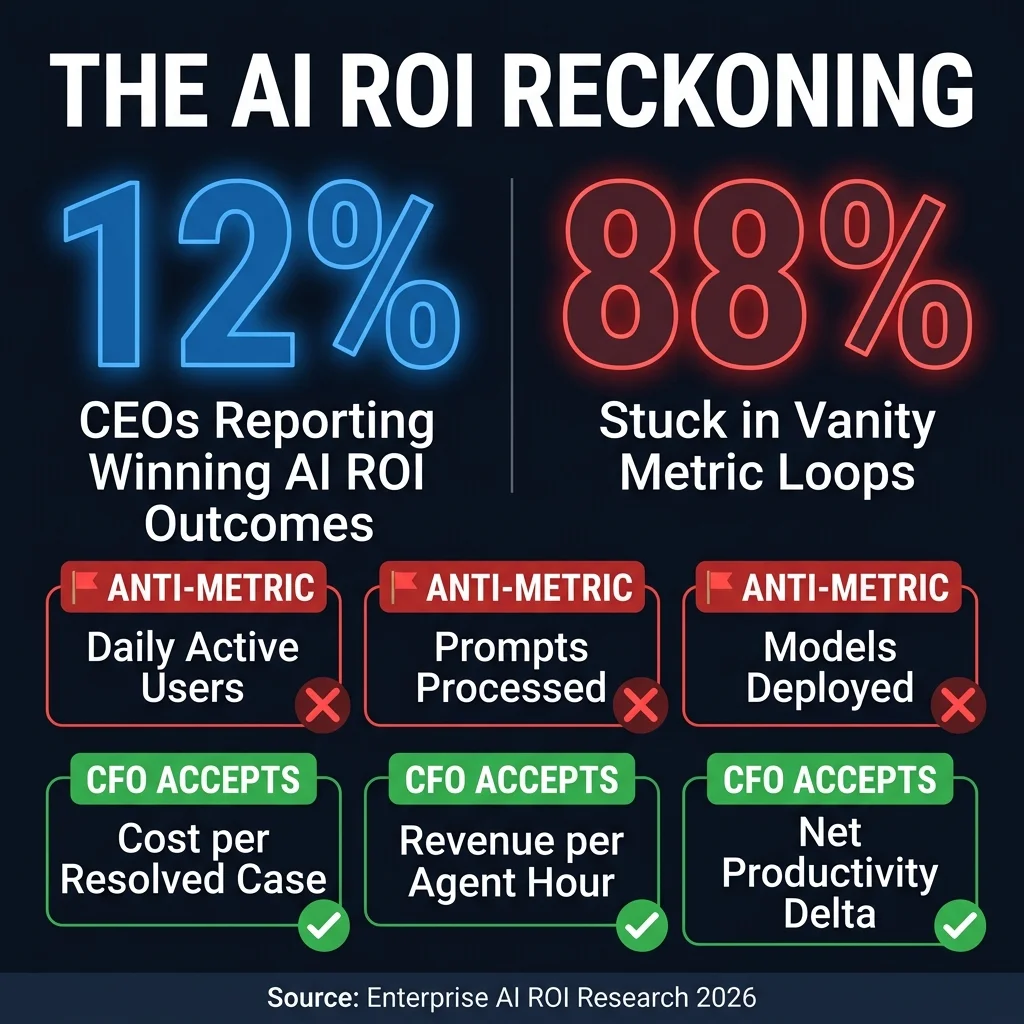
Research consistently shows that roughly 12% of enterprise CEOs report winning outcomes from their AI investments. The other 88% aren't failing because their AI doesn't work. They're failing because they can't prove it does. The measurement problem is costing more in board-level defunding decisions than the technology itself costs to run. This article gives you the exact scorecard structure, the financial case framework, and the language CFOs and boards respond to — because the difference between a funded AI program and a shelved one often comes down to a single slide deck with the right four numbers on it.
The 12% Problem {#the-12-percent-problem}
I've sat in enough transformation steering committees to recognize the pattern.
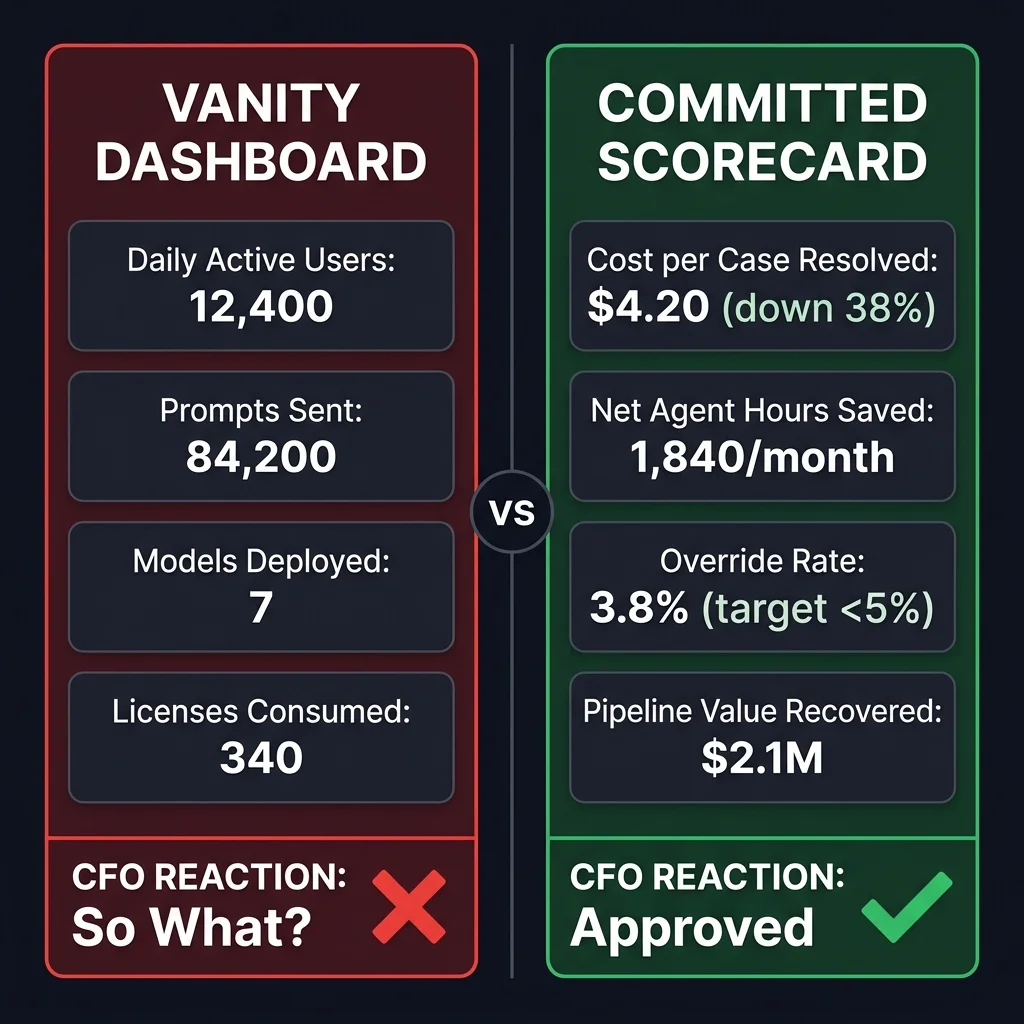
The AI program director walks in with a dashboard showing 84,000 prompts processed, 340 licenses activated, 12 models deployed, and a 72% user adoption rate. The CFO looks at the slide for approximately four seconds. Then asks: "What's the business impact?"
The director doesn't have a clean answer. The CFO's expression doesn't change — but the budget conversation that follows does.
This is the 12% problem. Research on enterprise AI programs consistently finds that only about 1 in 8 CEOs can point to winning, measurable outcomes from their AI investments. The other 7 in 8 are running activity — generating reports about how much AI activity is happening — but can't close the loop to a financial outcome that would justify continued investment.
The measurement gap is doing more damage than the technology gap. Boards aren't defunding AI because it doesn't work. They're defunding it because nobody designed a measurement system that proves it does.
The fix isn't a better AI. It's a better scorecard.
Why AI Dashboards Fail at the Board Level {#why-ai-dashboards-fail}
Most AI dashboards are built by the teams running the AI programs — which means they're optimized for the things those teams can easily measure: system activity, usage rates, feature adoption. These are the wrong metrics for a board audience.
Here's the fundamental misalignment. Operations teams care about whether the AI is working. Boards care about whether the AI is producing financial outcomes that justify its cost and risk. These are different questions that require different measurement systems.
The operational team's dashboard answers: "Is the system running? Is it being used? Is it producing outputs?" That's useful for the people managing the system. It's useless for the people deciding whether to fund the next phase.
The board's questions are different: "What would this cost us without the AI? What did we commit to deliver? What have we actually delivered? What's the risk-adjusted financial case for the next 18 months?" These questions require a measurement system that starts with the business outcome — not the AI system — and works backward to the metrics that prove causation.
Most AI programs build their measurement systems forward, starting from the technology: "Here's what our AI does. Here's how we'll measure whether it's doing it." Board-grade measurement goes backward: "Here's the business outcome we committed to produce. Here's the baseline we're comparing against. Here's the evidence the AI caused the delta."
That backward-built measurement system is what 88% of AI programs don't have.
Practitioner note: The single most common cause of board-level AI defunding is not failed technology — it's the inability to connect AI activity to business outcomes in language that finance teams accept. I've seen AI programs producing genuinely excellent operational results get defunded because nobody translated those results into a board-legible financial impact statement. The measurement system is not a nice-to-have. It's the survival mechanism.
The Four Levels of AI Metrics {#four-levels-metrics}
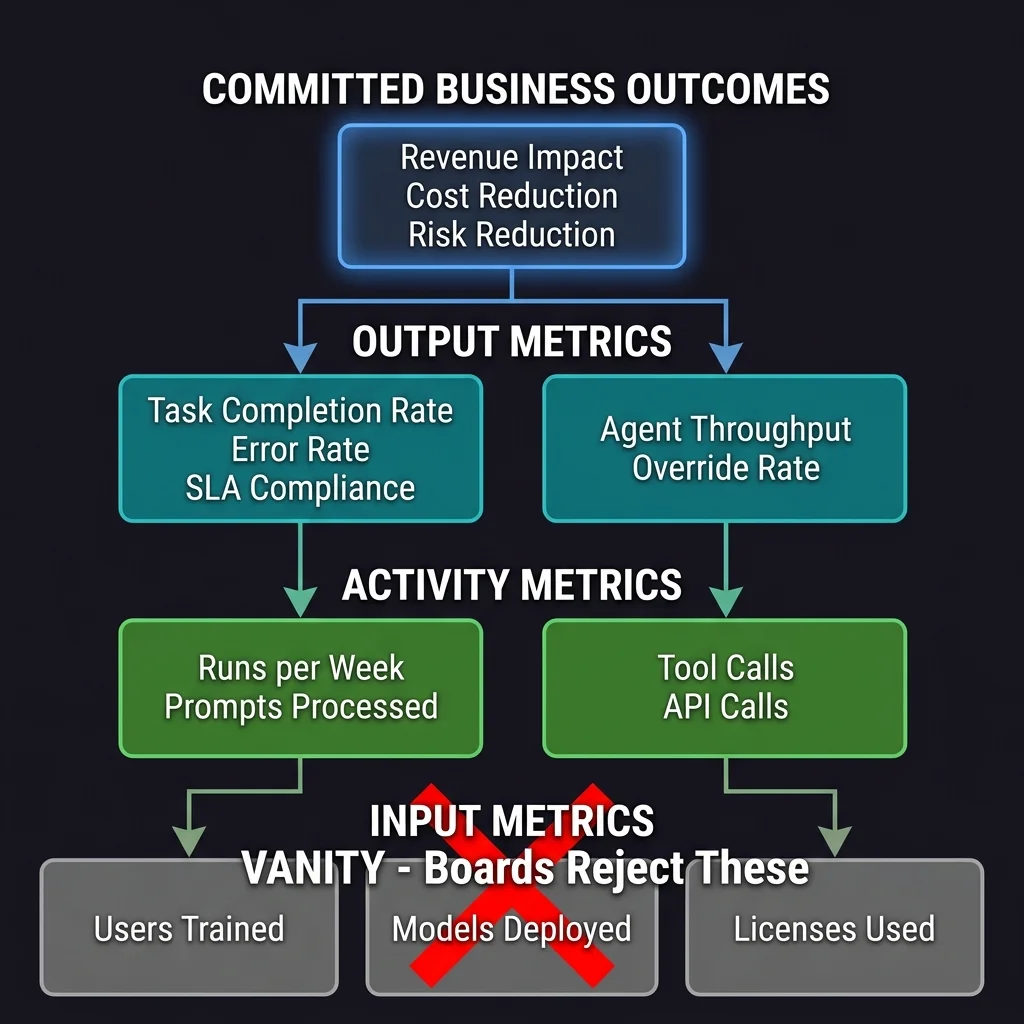
Before building a scorecard, understand the hierarchy. There are four levels of AI metrics, and only the top level reliably survives board scrutiny.
Level 1: Input Metrics (Vanity)
Users trained. Licenses activated. Models deployed. APIs configured. These measure investment and setup, not value. Every dollar of AI budget produces input metrics. Input metrics prove you spent money, not that you produced value. CFOs with any financial sophistication will explicitly ask you to remove these from board presentations.
Level 2: Activity Metrics (Operational)
Prompts processed. Queries answered. Tasks completed. API calls made. These measure throughput — the AI is running and doing things. This is operationally useful for the team managing the system. It's insufficient for board justification. "We processed 84,000 prompts" tells the board nothing about whether those prompts produced anything worth the cost.
Level 3: Output Metrics (Directionally Useful)
Task completion rate. Override rate. SLA compliance. Error rate. These are closer to business value — they measure whether the AI is doing what it's supposed to do, with acceptable accuracy and reliability. For boards, output metrics are supporting evidence, not primary evidence. They validate that the system is performing. They don't prove that performance is producing business value.
Level 4: Outcome Metrics (Board-Grade)
Cost per case resolved. Revenue per agent hour. Net productivity delta. Risk incidents prevented. Cycle time reduction (in dollars). FTE hours freed. These connect directly to P&L impact. They can be validated by finance teams using standard accounting methods. They make a committed business case that survives audit. These are the only metrics that should lead a board presentation.
The Anti-Metrics Catalog: What to Delete Immediately {#anti-metrics-catalog}
If any of these appear on your AI program board dashboard, remove them before the next board meeting. They don't just fail to convince CFOs — they actively signal that the AI program team doesn't understand how to measure business value.
Daily Active Users (DAU) — The software-product metric that has no business in a transformation program. No board ever approved an ERP implementation because of DAU.
Prompts Processed — Counting AI activity is like counting photocopies to measure the ROI of a photocopier. It measures consumption, not value creation.
Models Deployed — This is a cost metric disguised as a progress metric. More models deployed means more infrastructure cost, not more value.
Seats Activated / License Utilization — A utilization rate proves you distributed access. It proves nothing about whether that access produced business outcomes.
Experiments Run / Pilots Launched — Experiments and pilots are investment activities. Their job is to produce a business case. Until they produce one, reporting their count is a signal that the program hasn't produced results.
AI Feature Adoption Percentage — A measurement of whether people are using the AI, not whether the AI is producing value. People used fax machines at 100% adoption rates. Adoption is not outcomes.
Training Hours Completed — This belongs in the training department's metrics, not a board-level AI scorecard. Completed training is an input cost.
Response Time / Latency Improvements — Technically valid operational metrics. Board-invalid as primary value measures. A response time improvement is valuable only if it can be translated into a dollar outcome (e.g., "reduced resolution time from 8 minutes to 2 minutes, saving $X per case").
The rule: every metric that appears on a board slide must connect to a line on the P&L within two inferential steps. If you can't trace it, remove it.
Building the Board-Grade AI Scorecard {#building-the-scorecard}
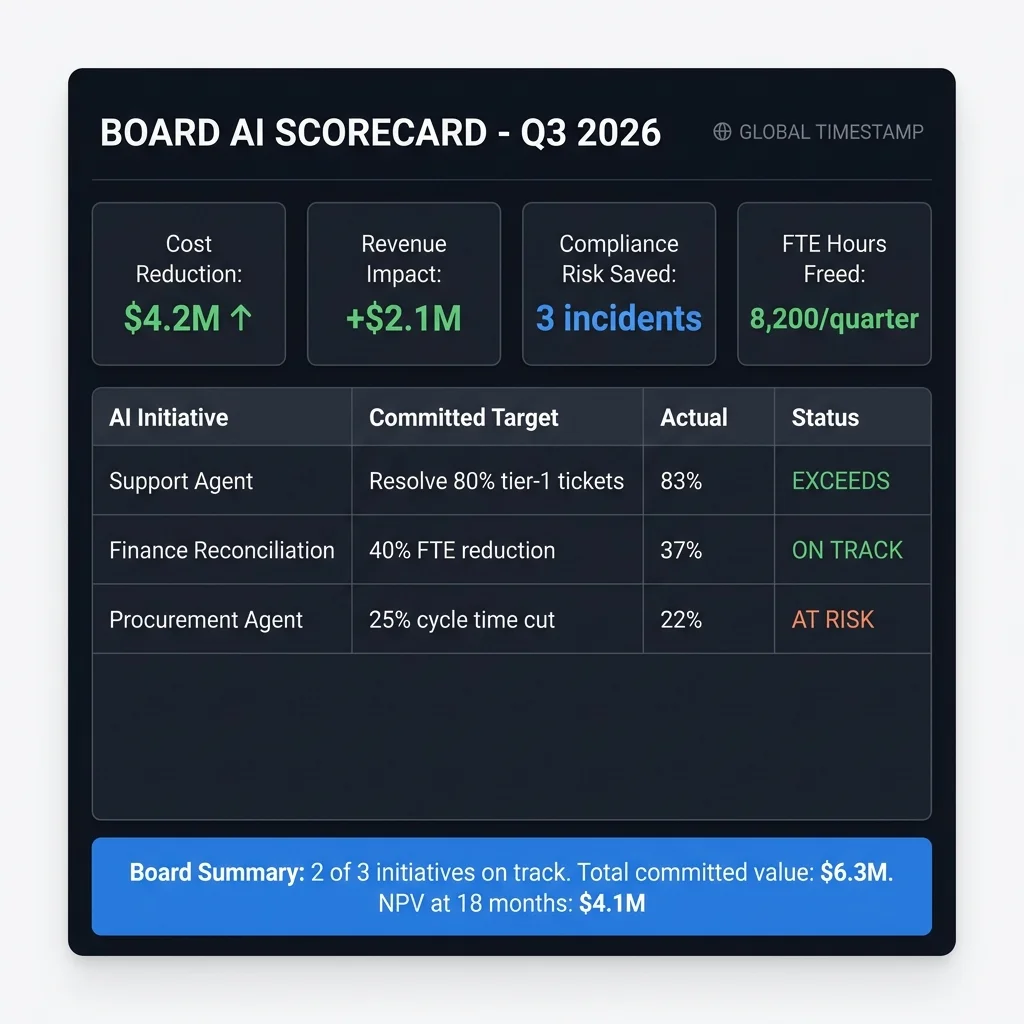
A board-grade AI scorecard has five mandatory sections. In that order, every time.
Section 1: Program Summary (One Slide)
The initiative name, the committed business outcome(s), the total investment to date, and the current delivery status (on track / at risk / exceeds). Maximum six data points. The CFO should be able to understand the program's financial position in under 60 seconds from this slide.
Section 2: Baseline vs. Actual (Outcome Table)
For each AI initiative, show: the baseline metric before AI deployment, the committed target, the current actual, and the variance. This is the core of the board-grade scorecard. Every number must have a source. "Current actual" must be validated by the finance team, not self-reported by the AI program team. The finance team's stamp of approval is what separates a real board presentation from a self-congratulatory activity report.
Section 3: Financial Impact Summary
Total cost reduction attributable to AI (with methodology). Total revenue impact attributable to AI (with methodology). Risk events avoided (quantified). Total value created. Net value after total cost of ownership (TCO). Variance from committed case. Simple, clean, finance-validated.
Section 4: Risk and Governance
Override rate trends (are agents becoming less reliable over time?). Compliance incidents. Data governance status. Key risks and mitigations. This section answers the board's implicit question: "Could this AI cause us a reputational or regulatory problem?"
Section 5: Next Quarter Committed Targets
What specific outcomes will the AI program deliver in the next 90 days? These become the baseline for Section 2 at the next board meeting. The commitment cycle creates accountability and prevents the chronic "we're still in progress" slide that boards learn to distrust.
The Financial Case Framework (With Numbers) {#financial-case-framework}
The financial case for an AI program has four components that finance teams expect to see in any capital allocation request.
Component 1: Baseline Cost Structure
What is the current cost of the process the AI will replace or augment? For a support agent: average handle time × cost per FTE minute × monthly volume = baseline cost. This is your before number. It must come from finance team data, not estimates from the AI project team.
Component 2: AI-Attributed Cost Delta
With the AI in place, what does the same process cost? The delta is the AI's direct cost contribution. But it must account for: AI infrastructure cost, AI maintenance cost, human oversight cost (if override rate is 8%, someone's handling 8% of cases manually — that's not free), and any transition costs. Net delta = gross saving minus true cost to achieve.
Component 3: Revenue Impact (If Applicable)
For revenue-generating use cases (sales agent, lead routing, customer retention agent): what is the measured revenue impact attributable to the AI? The finance team will ask for this attribution methodology in detail. "We think the AI helped close more deals" isn't acceptable. "AI routing reduced time-to-first-contact by 68% for Tier 1 leads; historical data shows 12-point conversion rate improvement when T2FC is below 4 hours; applied to 340 AI-routed Tier 1 leads, projected revenue impact is $X" is acceptable.
Component 4: Risk and Compliance Value
For compliance and risk use cases: what is the cost of a risk event this AI prevents? Use historical incident costs, regulatory fine data, or insurance actuary estimates. Three prevented compliance incidents at $80K average cost each is $240K in quantifiable risk value — a real number that belongs on a CFO slide.
Agent-Specific Metrics That CFOs Understand {#agent-specific-metrics}
Not all AI metrics are equivalent across use cases. Here's the metric set by agent type that CFOs typically accept.
Tier 1: Customer-Facing Service Agents
- Cost per resolved case (compare: with AI vs. without AI baseline)
- First-contact resolution rate (compare to pre-AI baseline)
- Average handle time delta × cost per minute
- Escalation rate (lower is better — escalations cost more)
- CSAT delta (if tracked by finance as a leading revenue indicator)
Tier 2: Internal Operations Agents (Finance, HR, Procurement)
- FTE hours saved per month × fully-loaded FTE cost per hour
- Processing time reduction × opportunity cost of backlog
- Error rate reduction × average error remediation cost
- Cycle time compression (in financial terms: faster cycle = lower working capital requirement)
Tier 3: Revenue-Generating Agents (Sales, RevOps, Marketing)
- Revenue per agent interaction hour
- Pipeline value recovered from routing improvements
- Conversion rate delta × average deal value
- Time-to-close reduction × weighted average pipeline value
Tier 4: Compliance and Risk Agents
- Risk incidents detected and prevented × estimated incident cost
- Regulatory finding reduction × average fine or remediation cost
- Audit preparation time reduction × FTE cost
- Policy violation rate reduction × cost per violation event
The translation principle: every metric that starts as an operational measure (handle time, error rate, cycle time) must be translated into a financial unit (dollars) before it goes on a board slide. Operations teams talk in operational units. Finance teams validate in financial units. Boards decide in financial units.
Constructing the NPV and Payback Case {#npv-payback-case}
The board will eventually ask for a formal financial case. Here's how to build it without the common mistakes.
Step 1: Define the Cost of the AI Program
- Year 1: Infrastructure (cloud/API costs) + implementation (one-time) + training and change management
- Year 2+: Infrastructure (ongoing) + maintenance (prompt tuning, model updates, integration maintenance) + governance overhead (audit, compliance monitoring)
- Add 20% contingency on Year 1 and 15% on Year 2+ — finance teams will apply this themselves and it looks better if you've already done it
Step 2: Define the Benefits by Year
- Year 1: Conservative (AI is learning, adoption is ramping). Use 60-70% of full-run-rate benefits for the first year
- Year 2: Full run-rate benefits, compounding if volume grows
- Year 3: Full run-rate + additional initiatives deployed in Year 2
Step 3: Apply the Discount Rate
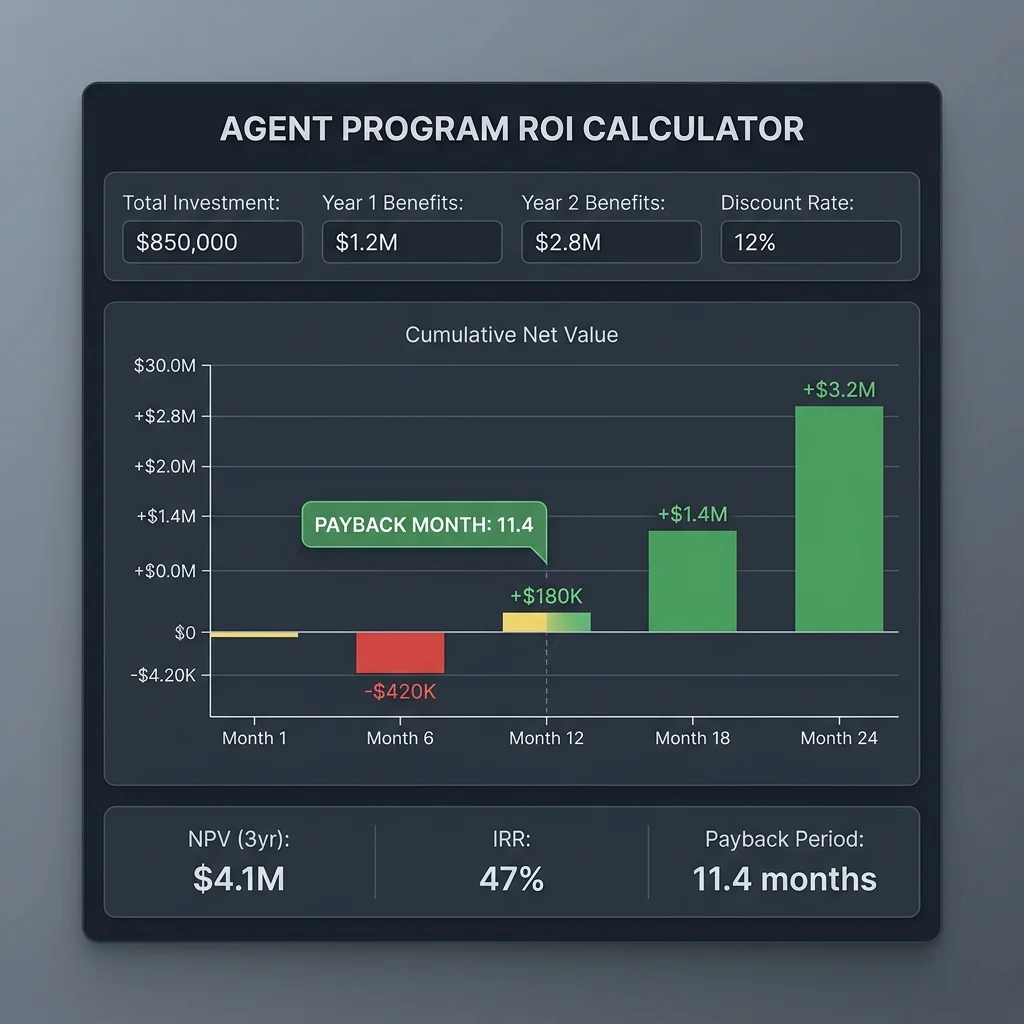
Finance teams use a hurdle rate — typically 10-15% for enterprise technology investments. Use 12% as a default if the CFO hasn't specified. Apply it to future years' benefits to calculate NPV.
Step 4: Calculate Payback Period
Cumulative benefits minus cumulative costs, month by month. The month where the line crosses zero is your payback month. Under 12 months is excellent. 12-18 months is acceptable for enterprise programs. Over 24 months requires a compelling strategic case beyond ROI.
Step 5: Sensitivity Analysis
Show the CFO three scenarios: base case (your central estimates), downside (benefits at 70% of base, costs at 120% of base), and upside (benefits at 130% of base, costs at base). A CFO who sees the downside case still positive will fund the program. A CFO who doesn't see a sensitivity table will add their own in their head — probably more pessimistic than yours.
Deep Analysis: Scorecard Maturity Benchmark Table {#deep-analysis}
Most enterprise AI programs I've worked with are operating at Level 1 or 2 in 2026. The jump from Level 2 to Level 4 requires two things that are organizational rather than technical: engagement with the finance team on methodology, and the willingness to commit to specific outcomes rather than hedging with ranges and caveats.
Committing to specific outcomes feels risky. But ambiguity is more dangerous than commitment. Boards that don't get clear commitments fill the gap with skepticism.
Real-World Scorecard Patterns {#real-world-patterns}
Pattern A: Financial Services — Tier 1 Support Agent
A financial services firm deployed an AI agent for account inquiry resolution. Their initial board report showed 74% containment rate and 84,000 monthly queries handled. The CFO asked what the containment rate improvement was worth. The team didn't have that number. Three months later, after working with the finance team: baseline cost per case was $14.20 using human agents. AI-handled cases cost $0.94 including infrastructure and oversight. Monthly volume: 52,000 AI-handled cases. Monthly saving: $689,000. Annual: $8.3M against a $1.2M annual program cost. IRR: 591%. Once that slide existed, the program was expanded immediately. The technology hadn't changed. The measurement system had.
Pattern B: Manufacturing — Procurement Cycle Compression
A manufacturing company deployed an AI for procurement document processing. Initial report: 340 documents processed per week, 4.2 minutes average processing time. CFO response: "Is that good?" The finance team calculated: baseline processing was 22 minutes per document with 2 FTE. New model: 4.2 minutes with 0.3 FTE equivalent oversight. Weekly saving: 605 FTE hours at $48 fully-loaded = $29,040/week = $1.5M/year. Plus: faster procurement cycle reduced average payment days, improving working capital position by $3.2M. Total annual financial impact: $4.7M. Total program cost: $380K. Payback: 29 days. That's a board slide that gets an expansion vote, not a review.
Pattern C: Professional Services — Compliance Risk Reduction
A professional services firm using an AI for regulatory compliance monitoring struggled to quantify value because there were no "prevented incidents" to point to — the AI was doing preventive work. The finance team reconstructed value from historical data: in the 3 years before AI, they had 7 regulatory findings averaging $95K in remediation cost each. AI deployment year: 2 findings. The delta (5 findings × $95K) = $475K in avoided costs plus 340 compliance team hours freed. At $95/hour: $32,300 in labor savings. Total annual value: $507K against $180K annual program cost. The absence of incidents, once quantified historically, is a legitimate financial outcome.
Presenting to the Board: Structure and Language {#presenting-to-board}
Board presentations for AI programs should follow the investor relations model, not the project status model. Boards are making investment decisions, not reviewing project timelines.
The right structure (five slides maximum):
- What we committed. The original business case in one table: initiative, committed outcome, committed date, investment.
- What we delivered. Current actual against committed, finance-validated, with variance explanation if any.
- The financial picture. Total investment to date. Total value created. Net position. Forward NPV at current trajectory.
- Risks and governance. Top 3 risks. Mitigations in place. Compliance status.
- Next quarter commitments. Specific outcomes. Dollar values. Dates.
Language that CFOs accept:
- "Our baseline was X. Current measurement shows Y. The delta, validated by finance, is Z."
- "At current run rate, the NPV of this program over 24 months is $X at a 12% hurdle rate."
- "Override rate is 3.8%, within our 5% governance threshold, indicating the agent is producing board-grade outputs."
Language that kills funding conversations:
- "We're seeing great traction" (not a number)
- "User feedback has been positive" (not a financial outcome)
- "We expect significant savings" (not a commitment)
- "The technology is working well" (the board assumed it would work — they funded its purchase)
- "We're still in the learning phase" (boards don't fund learning phases indefinitely without evidence of progress)
The discipline of board-grade language is essentially: if you can't put a dollar value and a date on it, don't say it in a board presentation.
Pitfalls and Anti-Patterns {#pitfalls}
Anti-pattern 1: The Self-Reported Scorecard
AI program teams report their own results without finance team validation. Finance teams know this is happening and apply significant mental discounts to self-reported numbers. Getting the CFO's own team to validate your numbers before the board meeting is the single highest-leverage action you can take to improve board confidence in your AI program.
Anti-pattern 2: Measuring the Wrong Baseline
The AI saves 4 minutes per customer interaction — but the baseline was 22 minutes for a senior agent, and the AI-handled queries are the simple tier-1 cases that a junior agent would have handled in 8 minutes. The actual saving is 4 minutes, not 18. Boards that discover methodology errors in year 2 defund programs in year 3. Use the correct baseline from the correct population.
Anti-pattern 3: Ignoring the Total Cost of Ownership
AI programs routinely underestimate ongoing costs: prompt engineering maintenance, model update regression testing, oversight labor, governance overhead, integration maintenance as external APIs evolve. A program that looks like 200% IRR at deployment often looks like 40% IRR when TCO is correctly calculated. Build TCO into the financial case from the first board presentation, not as a later correction.
Anti-pattern 4: The Attribution Problem Left Unsolved
"The AI contributed to a $2M revenue increase" — but so did the new sales hire, the product update, and the market expansion. Without a clear attribution methodology, the CFO will attribute it all to the other factors and zero to the AI. Work with the finance team to define attribution methodology before you claim revenue impact, not after.
Anti-pattern 5: No Commitment Cadence
Programs that never commit to specific next-quarter outcomes train boards to expect ambiguity. Boards that expect ambiguity eventually defund the programs that produce it. Committing to specific outcomes every quarter — even if you occasionally miss by 10% — builds more board confidence than perpetual open-ended "progress is being made" updates.
2027-2030: The Future of AI Program Governance {#future-roadmap}
2027: Real-Time AI Value Accounting
CFOs will demand real-time dashboards integrating AI program outcomes directly into FP&A systems. AI value will be tracked on the same cadence as financial performance — weekly, not quarterly. Programs that can't instrument this level of visibility will face the same scrutiny as any other significant operational investment.
2028: AI Program Auditing Standards
Auditing standards for AI program value claims will emerge, likely driven by regulatory requirements in financial services and healthcare. External auditors will begin to independently verify AI-attributed value in the same way they verify other significant operational claims. Programs that have been using self-reported metrics will face retrospective scrutiny.
2029: AI Unit Economics as a Standard CFO Metric
"Cost per AI-handled task" and "revenue per agent interaction hour" will appear in standard management accounts alongside conventional productivity metrics. CROs and COOs will be expected to report these metrics without being prompted, in the same way they report labor productivity today.
2030: Portfolio-Level AI ROI Management
The evolution of board-level AI governance: CFOs will manage AI programs as portfolios, with portfolio-level return targets, rebalancing decisions, and sunset criteria for programs that fall below hurdle rates. The measurement system you build today becomes the foundation for the portfolio management system that CFOs will require in four years.
90-Day Transformation Checkpoint {#transformation-checkpoint}
When to bring in advisory: The scorecard design work — baseline methodology, attribution framework, finance team engagement, NPV model construction — is where most AI program teams get stuck. It's financial modeling and organizational alignment work that requires knowledge of both AI operations and corporate finance conventions. If your program has been running for more than two quarters without a finance-validated outcome metric, the gap is costing you board confidence that compounds each quarter. The Proof-of-Impact AI Transformation Program provides the complete framework with templates. Start with a scoping conversation if you want a practical assessment of where your measurement gaps are.
Days 1–30: Audit and Baseline
- Inventory all metrics currently reported in your AI program dashboard
- Classify each metric by level (input/activity/output/outcome)
- Identify your top 3 AI initiatives and pull historical baseline data for each
- Schedule working session with finance team lead to agree on attribution methodology
Days 31–60: Build the Scorecard
- Construct outcome metrics for each initiative using finance-validated baselines
- Build the financial case: cost delta, benefit calculation, NPV model, sensitivity analysis
- Review draft with CFO or finance director before any board presentation
- Identify the two committed outcome targets for the next quarter
Days 61–90: First Board Presentation
- Present using the five-slide structure
- Commit to next-quarter targets explicitly
- Establish the quarterly commitment cadence as a standing board agenda item
- Measure: did the board ask different questions? Did funding conversations shift?
Key Takeaways {#key-takeaways}
- Only 12% of CEOs report winning AI ROI — the differentiator is a board-grade measurement system with committed outcomes, not better technology
- Boards decide in financial units — every metric must translate to a P&L impact within two inferential steps or it doesn't belong on a board slide
- Anti-metrics actively harm — daily active users, prompts processed, models deployed, and seats activated don't just fail to convince CFOs — they signal that the AI team doesn't understand how to measure business value
- Finance team validation is non-negotiable — self-reported metrics receive significant implicit discounts; getting finance to validate before the board meeting is the highest-leverage action available
- The NPV and payback case has five components — baseline costs, AI-attributed cost delta, revenue impact (if applicable), risk value, and TCO — and must include sensitivity analysis
- Commit to specific outcomes every quarter — ambiguity trains boards to expect ambiguity; specific commitments with variance accountability build the confidence that sustains funding
- Level 4 maturity is the funding threshold — committed outcome scorecards with finance validation consistently result in board approval; Level 1-2 measurement consistently results in budget freeze or defunding
FAQ {#faq}
What is the single most important thing I can do to improve board confidence in my AI program?
Get your finance team to validate your outcome metrics before the next board presentation. The moment a board realizes the AI program team's numbers have been independently verified by the CFO's own people, the credibility gap closes. Self-reported results are always discounted by experienced board members — not because they assume dishonesty, but because they know operational teams naturally measure what makes their programs look successful. Finance team validation changes the conversation from "that's what the AI team says" to "that's what finance confirmed."
How do I measure AI value when the use case is preventive (no incidents happened)?
Use historical incident rate and cost data. In the three years before AI deployment, how many incidents of the type the AI prevents occurred? What was the average remediation cost? Apply the incident rate reduction (if measurable) or the absence of incidents in the AI-monitored population (compared to the non-AI-monitored population) to calculate avoided cost. This is standard actuarial methodology and finance teams accept it. The key is to establish the methodology and the historical baseline before claiming the value — not after the first year of operation.
My AI program had a good first year but I'm worried about the payback calculation — costs are higher than expected. How do I handle this in a board presentation?
Present the revised financials proactively, not reactively. If the board discovers a cost overrun that you didn't disclose, trust is permanently damaged. If you disclose it yourself with a clear explanation of what changed, a revised forward case, and mitigations already in place, boards typically respond with increased confidence — because they've seen that your measurement system catches variances and your team is managing them. Show the sensitivity analysis that proves the program is still positive-NPV even with higher costs. Then show what you're doing to reduce costs in Year 2.
How do I handle attribution when multiple factors contributed to an outcome?
Attribution methodology should be defined with finance before you claim any revenue or cost impact — not reverse-engineered after the outcome occurs. The most defensible approach for revenue attribution: use a controlled comparison (AI-handled interactions vs. human-handled interactions of the same type), or use a regression model controlling for known co-variables (market conditions, sales headcount, product changes). For cost attribution: process-level costing is more defensible than portfolio-level allocation. "This process cost $X before and costs $Y after, and the AI is the only change in the process" is more auditable than "we attribute 30% of the efficiency improvement to AI."
At what point should we consider sunsetting an AI initiative based on financial performance?
Establish the sunset criteria in the original business case — before deployment. A common framework: if an initiative falls below 50% of its committed Year 1 outcome target by month 9, trigger a formal review with three options: remediate (specific plan to recover performance within 90 days), redeploy (pivot the AI to a higher-value use case), or sunset (exit with documented learnings). Organizations that define these criteria upfront make faster, less political decisions when programs underperform. Organizations that don't define them tend to keep funding underperforming programs indefinitely because there's no agreed-upon threshold that triggers a decision.
About the Author {#about-author}
Vatsal Shah is a business transformation architect with 15+ years leading technology-driven operating model change across financial services, manufacturing, and professional services. He has advised CIOs, CFOs, and transformation leads on building the measurement systems and governance frameworks that determine whether AI investments survive board scrutiny — and whether they get expanded rather than shelved.
He founded Business Tech Navigator to provide transformation leaders with the practitioner framework — not the vendor pitch — for moving from AI programs that demo well to AI programs that pay back.
For the complete stage-gate framework and KPI tree templates for moving AI programs from pilot approval to CFO-signed outcomes, explore the Proof-of-Impact AI Transformation Program Playbook. For the digital ROI measurement foundation that feeds board scorecards, see Digital Transformation ROI.
Conclusion {#conclusion}
The 12% of AI programs that are producing board-accepted outcomes aren't using better AI than the 88%. They built their measurement systems before they built their presentations, and they engaged their finance teams before they walked into a board meeting.
The CFO question — "what's the business impact?" — is not a hostile question. It's the right question, asked by someone whose job is to allocate capital to programs that produce returns and redirect capital away from programs that don't. An AI program that can't answer it clearly is a program that shouldn't be funded — not because the technology isn't working, but because the program can't prove it is.
The scorecard described in this article takes 4-6 weeks to build correctly, with finance team engagement. That investment pays back in the form of a board presentation that ends with an expansion vote instead of a budget review.
Ready to build the measurement system that gets your AI program funded for the next phase? Start with a scoping conversation — a practical assessment of where your measurement gaps are and what it takes to close them.
If your AI dashboard starts with 'daily active users,' the CFO has already stopped listening. Only 12% of CEOs report winning AI ROI — and the difference is always the same: a board-grade scorecard with committed outcomes, finance validation, and a real NPV case. The exact framework here →
{
  class="tok-str">"@context": class="tok-str">"https:class="tok-cm">//schema.org",
  class="tok-str">"@graph": [
    {
      class="tok-str">"@type": class="tok-str">"BlogPosting",
      class="tok-str">"headline": class="tok-str">"Board-Grade AI Scorecards: Metrics CFOs Actually Accept for Agent Programs",
      class="tok-str">"description": class="tok-str">"Only 12% of CEOs are winning on AI ROI. The difference is board-grade scorecards with committed outcomes, not vanity metrics. Build the CFO-accepted AI scorecard your agent program needs.",
      class="tok-str">"author": {
        class="tok-str">"@type": class="tok-str">"Person",
        class="tok-str">"name": class="tok-str">"Vatsal Shah",
        class="tok-str">"url": class="tok-str">"https:class="tok-cm">//businesstechnavigator.com"
      },
      class="tok-str">"datePublished": class="tok-str">"2026-07-23T00:00:00+00:00",
      class="tok-str">"dateModified": class="tok-str">"2026-07-23T00:00:00+00:00",
      class="tok-str">"image": {
        class="tok-str">"@type": class="tok-str">"ImageObject",
        class="tok-str">"url": class="tok-str">"https:class="tok-cm">//businesstechnavigator.com/uploads/content/blog/board-grade-ai-scorecard-cfo-metrics-agents-2026//uploads/content/blog/board-grade-ai-scorecard-cfo-metrics-agents-2026/banner.webp",
        class="tok-str">"width": 1200,
        class="tok-str">"height": 630
      },
      class="tok-str">"url": class="tok-str">"https:class="tok-cm">//businesstechnavigator.com/blog/board-grade-ai-scorecard-cfo-metrics-agents-2026",
      class="tok-str">"publisher": {
        class="tok-str">"@type": class="tok-str">"Organization",
        class="tok-str">"name": class="tok-str">"Business Tech Navigator",
        class="tok-str">"url": class="tok-str">"https:class="tok-cm">//businesstechnavigator.com"
      },
      class="tok-str">"keywords": class="tok-str">"AI program CFO metrics board reporting, proof of impact metrics, agent program ROI dashboard, committed outcomes not seat counts, AI unit economics, board AI governance reporting",
      class="tok-str">"articleSection": class="tok-str">"AI & Agentic Transformation",
      class="tok-str">"wordCount": 4100
    },
    {
      class="tok-str">"@type": class="tok-str">"FAQPage",
      class="tok-str">"mainEntity": [
        {
          class="tok-str">"@type": class="tok-str">"Question",
          class="tok-str">"name": class="tok-str">"What metrics do CFOs accept for AI programs?",
          class="tok-str">"acceptedAnswer": {
            class="tok-str">"@type": class="tok-str">"Answer",
            class="tok-str">"text": class="tok-str">"CFOs accept AI program metrics that connect directly to P&L impact: cost per case resolved, net FTE hours saved at fully-loaded cost, revenue per agent interaction hour, cycle time reduction in dollar terms, and risk incidents prevented at historical remediation cost — all validated by the finance team against a pre-AI baseline."
          }
        },
        {
          class="tok-str">"@type": class="tok-str">"Question",
          class="tok-str">"name": class="tok-str">"What is the single most important thing to improve board confidence in an AI program?",
          class="tok-str">"acceptedAnswer": {
            class="tok-str">"@type": class="tok-str">"Answer",
            class="tok-str">"text": class="tok-str">"Get your finance team to validate your outcome metrics before the next board presentation. Finance team validation changes the conversation from self-reported results (which boards discount) to independently verified outcomes, closing the credibility gap that causes AI programs to lose funding."
          }
        },
        {
          class="tok-str">"@type": class="tok-str">"Question",
          class="tok-str">"name": class="tok-str">"How do I build a financial case for an AI program?",
          class="tok-str">"acceptedAnswer": {
            class="tok-str">"@type": class="tok-str">"Answer",
            class="tok-str">"text": class="tok-str">"An AI program financial case has five components: baseline cost structure, AI-attributed cost delta (net of full TCO), revenue impact with attribution methodology, risk and compliance value using historical incident costs, and sensitivity analysis showing base/downside/upside scenarios. All components require finance team validation before board presentation."
          }
        }
      ]
    },
    {
      class="tok-str">"@type": class="tok-str">"BreadcrumbList",
      class="tok-str">"itemListElement": [
        { class="tok-str">"@type": class="tok-str">"ListItem", class="tok-str">"position": 1, class="tok-str">"name": class="tok-str">"Home", class="tok-str">"item": class="tok-str">"https:class="tok-cm">//businesstechnavigator.com" },
        { class="tok-str">"@type": class="tok-str">"ListItem", class="tok-str">"position": 2, class="tok-str">"name": class="tok-str">"Blog", class="tok-str">"item": class="tok-str">"https:class="tok-cm">//businesstechnavigator.com/blog" },
        { class="tok-str">"@type": class="tok-str">"ListItem", class="tok-str">"position": 3, class="tok-str">"name": class="tok-str">"Board-Grade AI Scorecards", class="tok-str">"item": class="tok-str">"https:class="tok-cm">//businesstechnavigator.com/blog/board-grade-ai-scorecard-cfo-metrics-agents-2026" }
      ]
    }
  ]
}